library(arrow)
library(dplyr)
library(janitor)
library(stringr)

nyc_taxi_zones <- read_csv_arrow(here::here("data/taxi_zone_lookup.csv"),
                                 as_data_frame = FALSE) |>
  clean_names()

airport_zones <- nyc_taxi_zones |>
  filter(str_detect(zone, "Airport")) |>
  pull(location_id, as_vector = TRUE)

dropoff_zones <- nyc_taxi_zones |>
  select(dropoff_location_id = location_id,
         dropoff_zone = zone) |>
  compute()

airport_pickups <- open_dataset(here::here("data/nyc-taxi")) |>
  filter(pickup_location_id %in% airport_zones) |>
  select(
    matches("datetime"),
    matches("location_id")
  ) |>
  left_join(dropoff_zones) |>
  count(dropoff_zone) |>
  arrange(desc(n)) |>
collect()Wrapping Up: ‘Big’ Data Analysis Pipelines with R
Arrow
- efficiently read + filter + join + summarise 1.15 billion rows
R
- read + wrangle spatial data + 🤩 graphics
library(sf)
library(ggplot2)
library(ggrepel)
library(stringr)
library(scales)

map <- read_sf(here::here("data/taxi_zones/taxi_zones.shp")) |>
  clean_names() |>
  left_join(airport_pickups,
            by = c("zone" = "dropoff_zone")) |>
  arrange(desc(n))

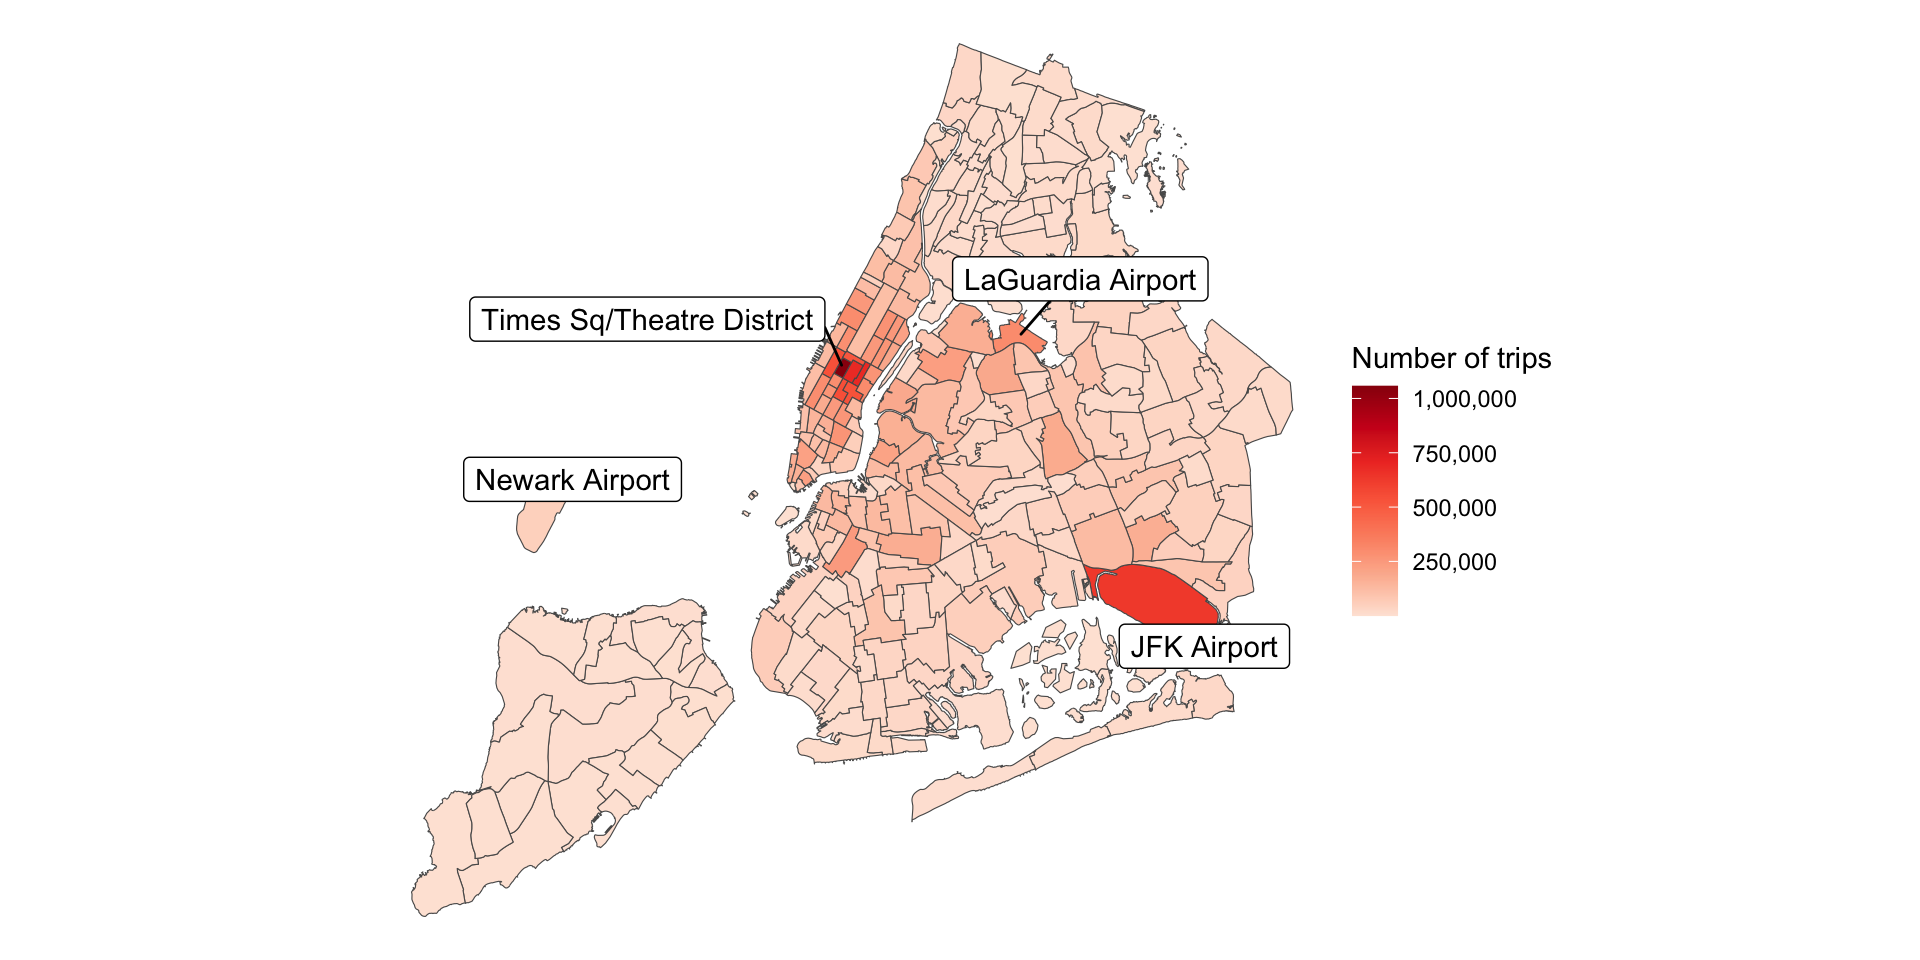
arrow_r_together <- ggplot(data = map, aes(fill = n)) +
  geom_sf(size = .1) +
  scale_fill_distiller(
    name = "Number of trips",
    labels = label_comma(),
    palette = "Reds",
    direction = 1
  ) +
  geom_label_repel(
    stat = "sf_coordinates",
    data = map |>
      mutate(zone_label = case_when(
        str_detect(zone, "Airport") ~ zone,
        str_detect(zone, "Times") ~ zone,
        .default = ""
      )),
    mapping = aes(label = zone_label, geometry = geometry),
    max.overlaps = 60,
    label.padding = .3,
    fill = "white"
  ) +
  theme_void()
Arrow + R Together: {arrow}

