07:00
Steal like an Rtist: Creative Coding in R
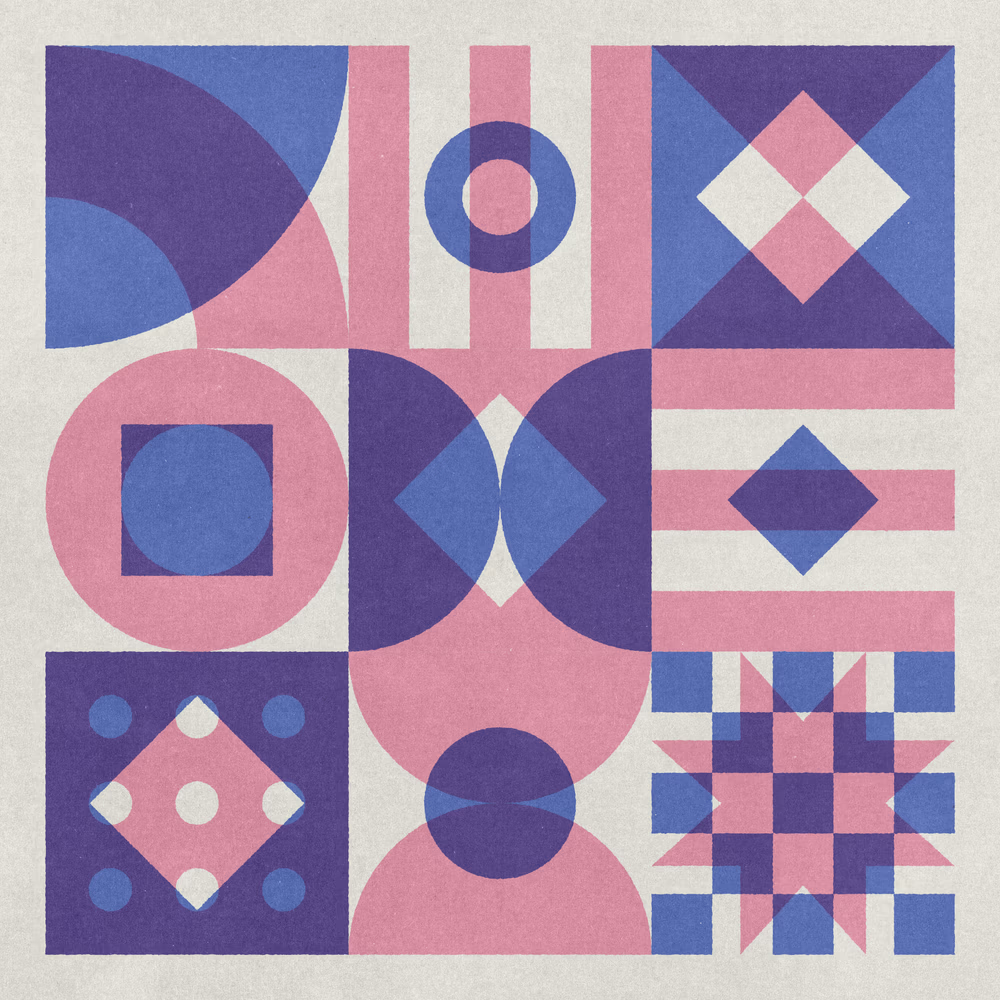
Riso Grids
Ryan Miglinczy
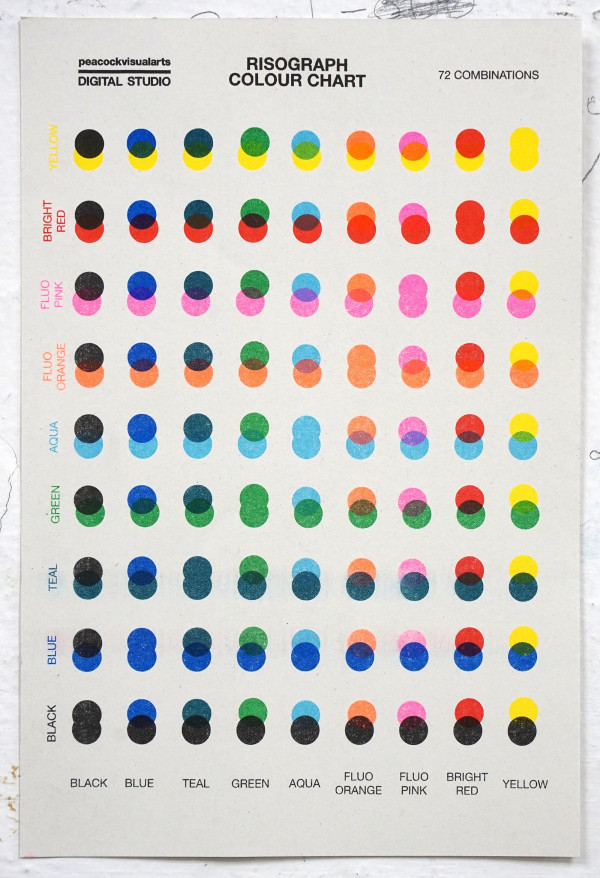
Risograph printing
Invented by the Riso Kagaku Corporation in the mid-1980s in Tokyo
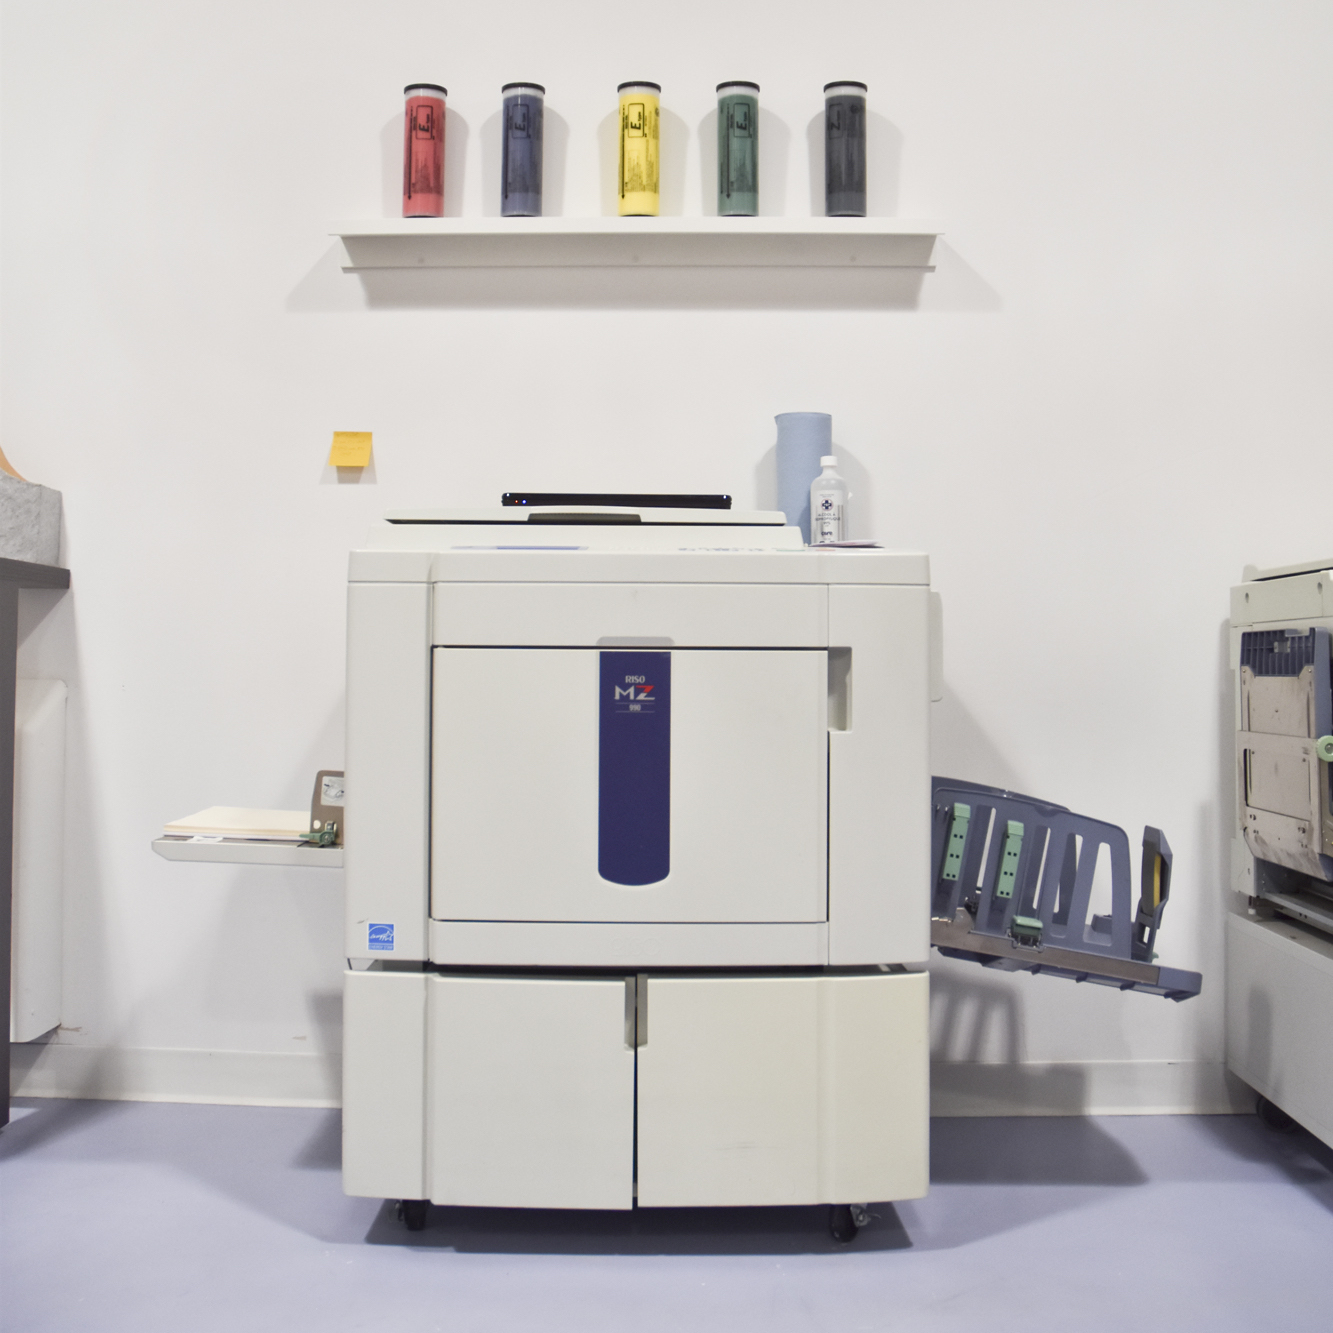
Risograph printer, via Moniker Press
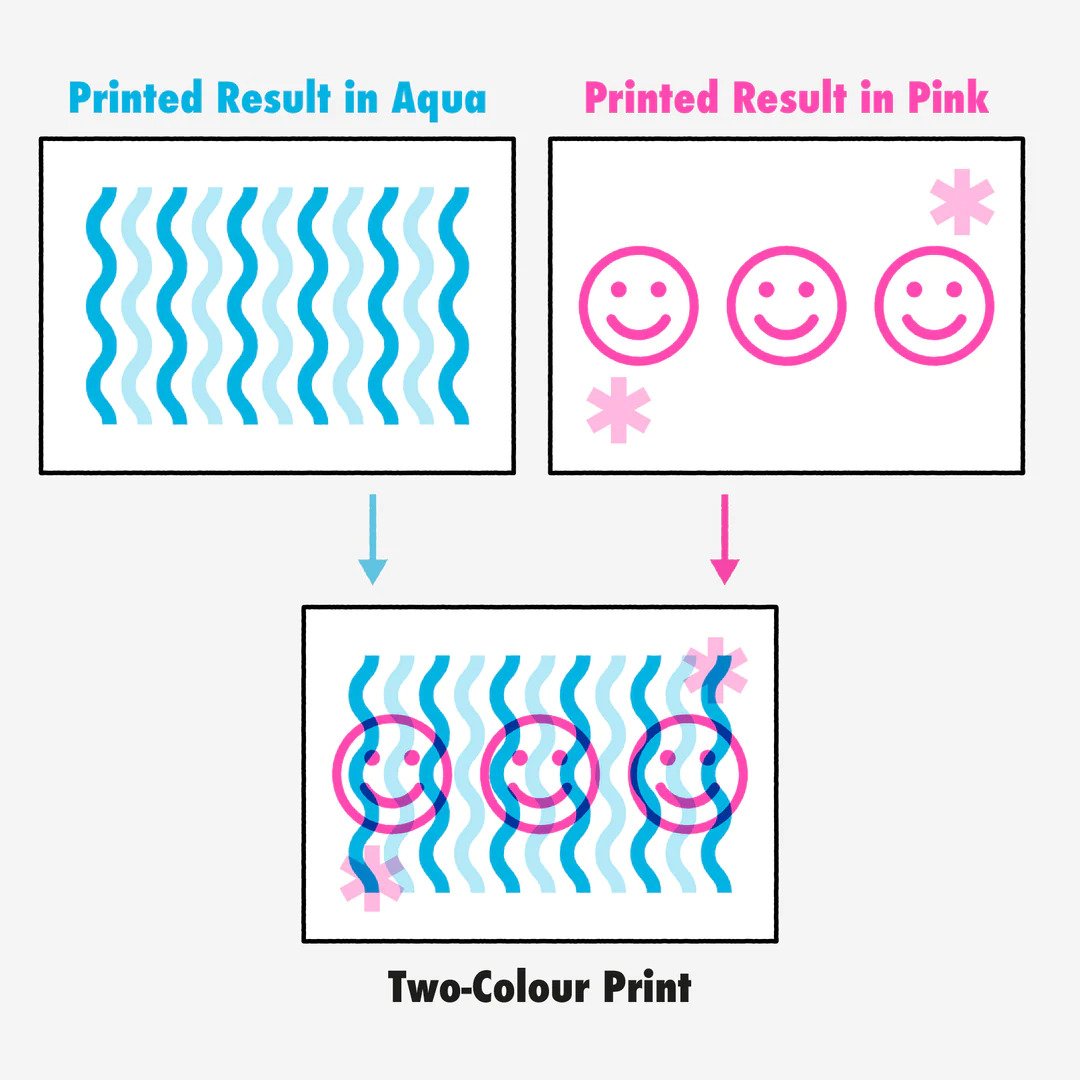
Risograph printing
Images are created in layers - each layer is one color, and layers are combined to create different colors and combinations
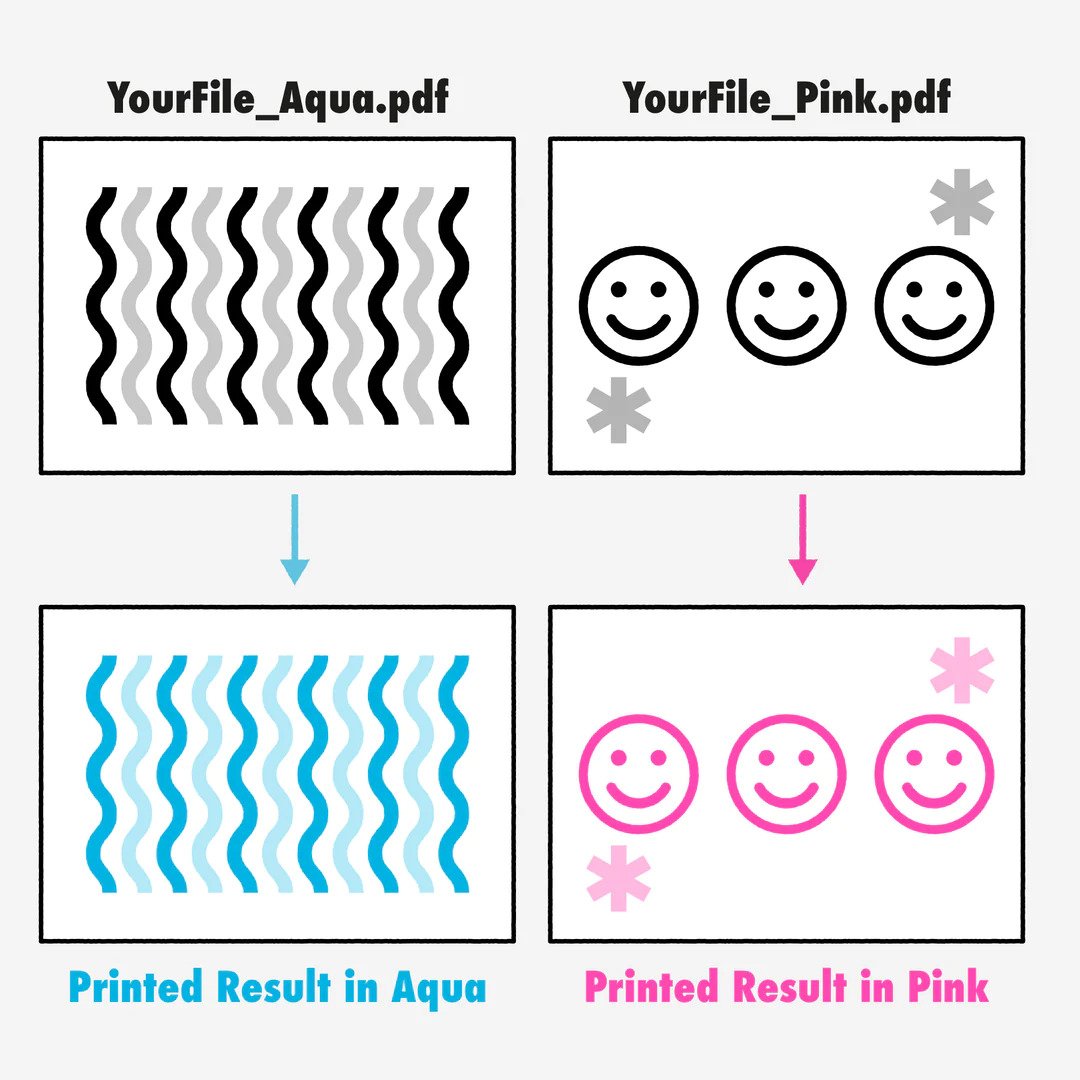
Risograph printing
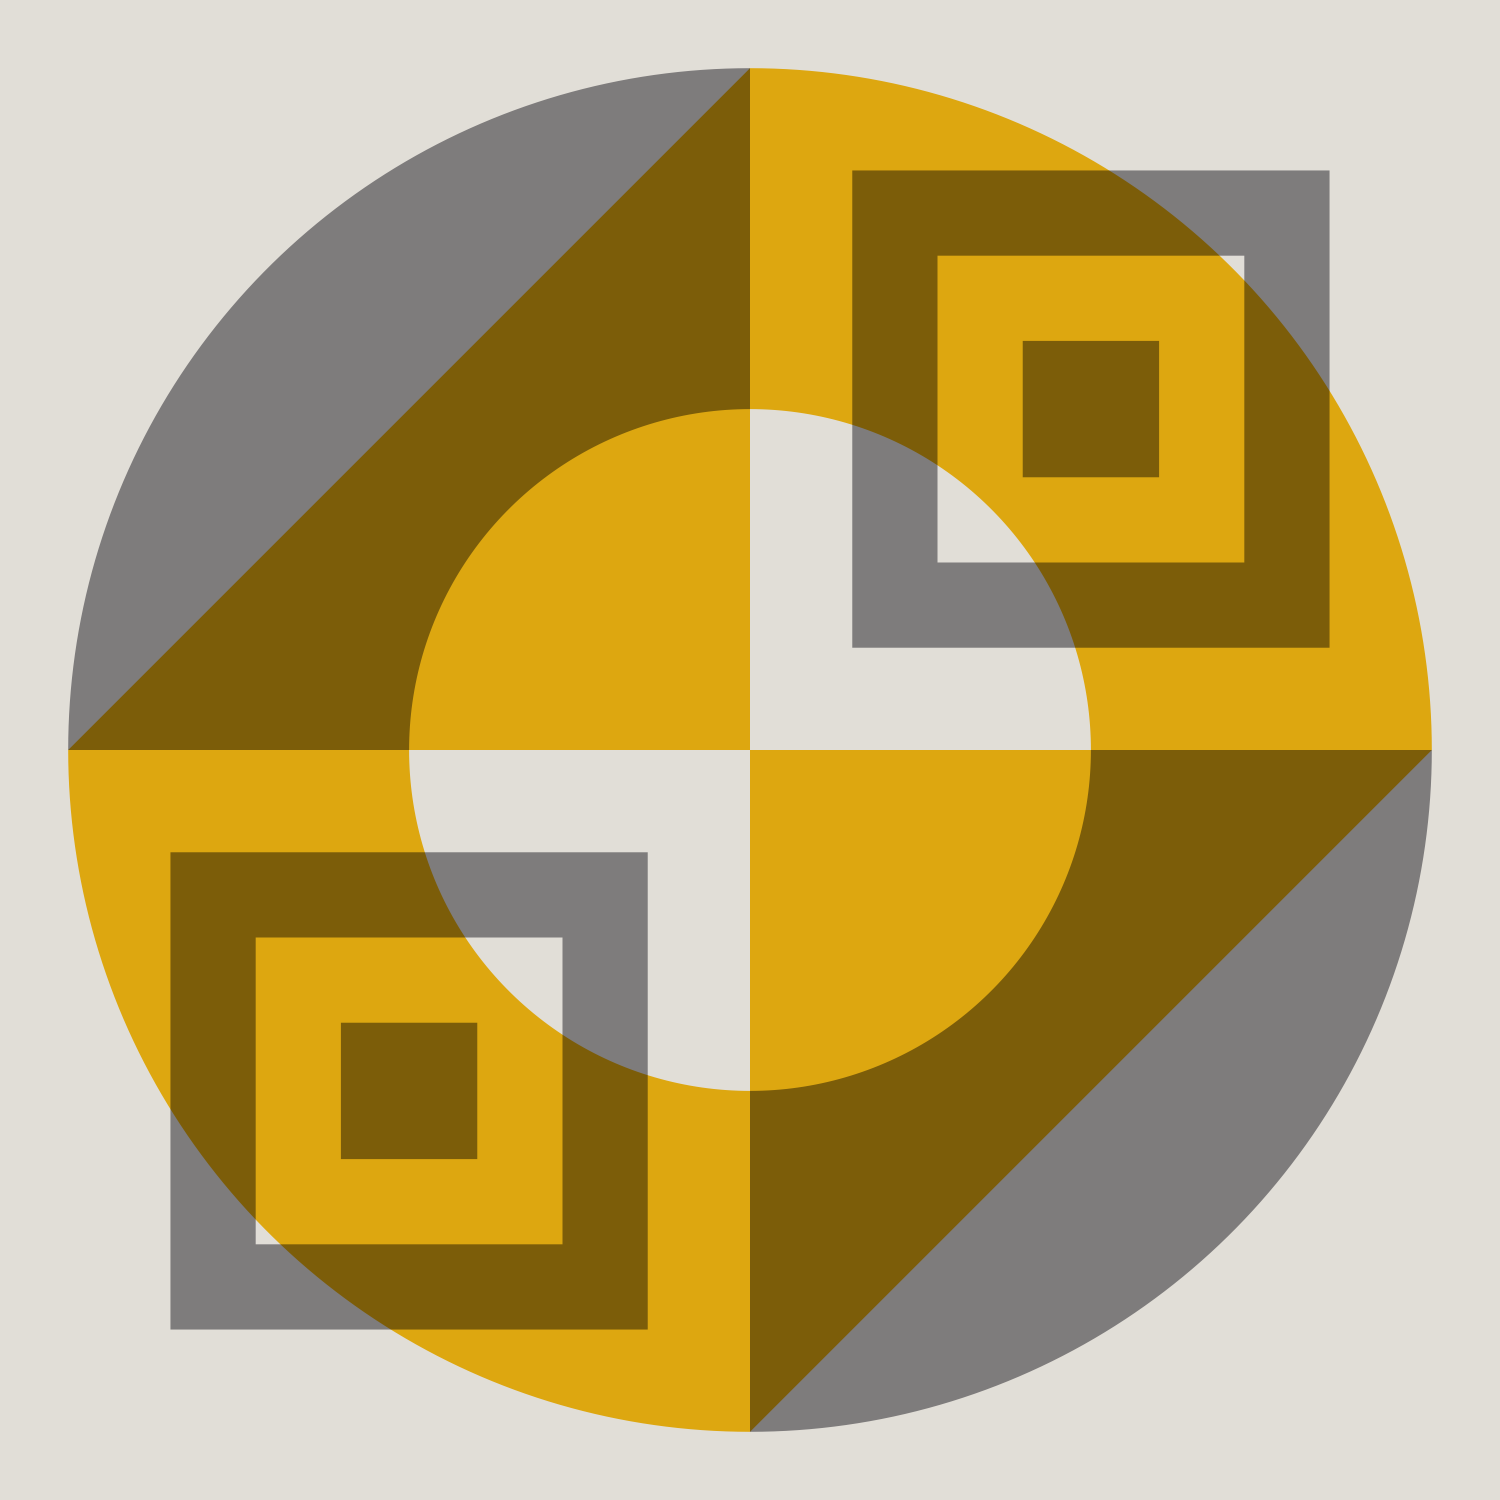
Layer 1
Layer 2
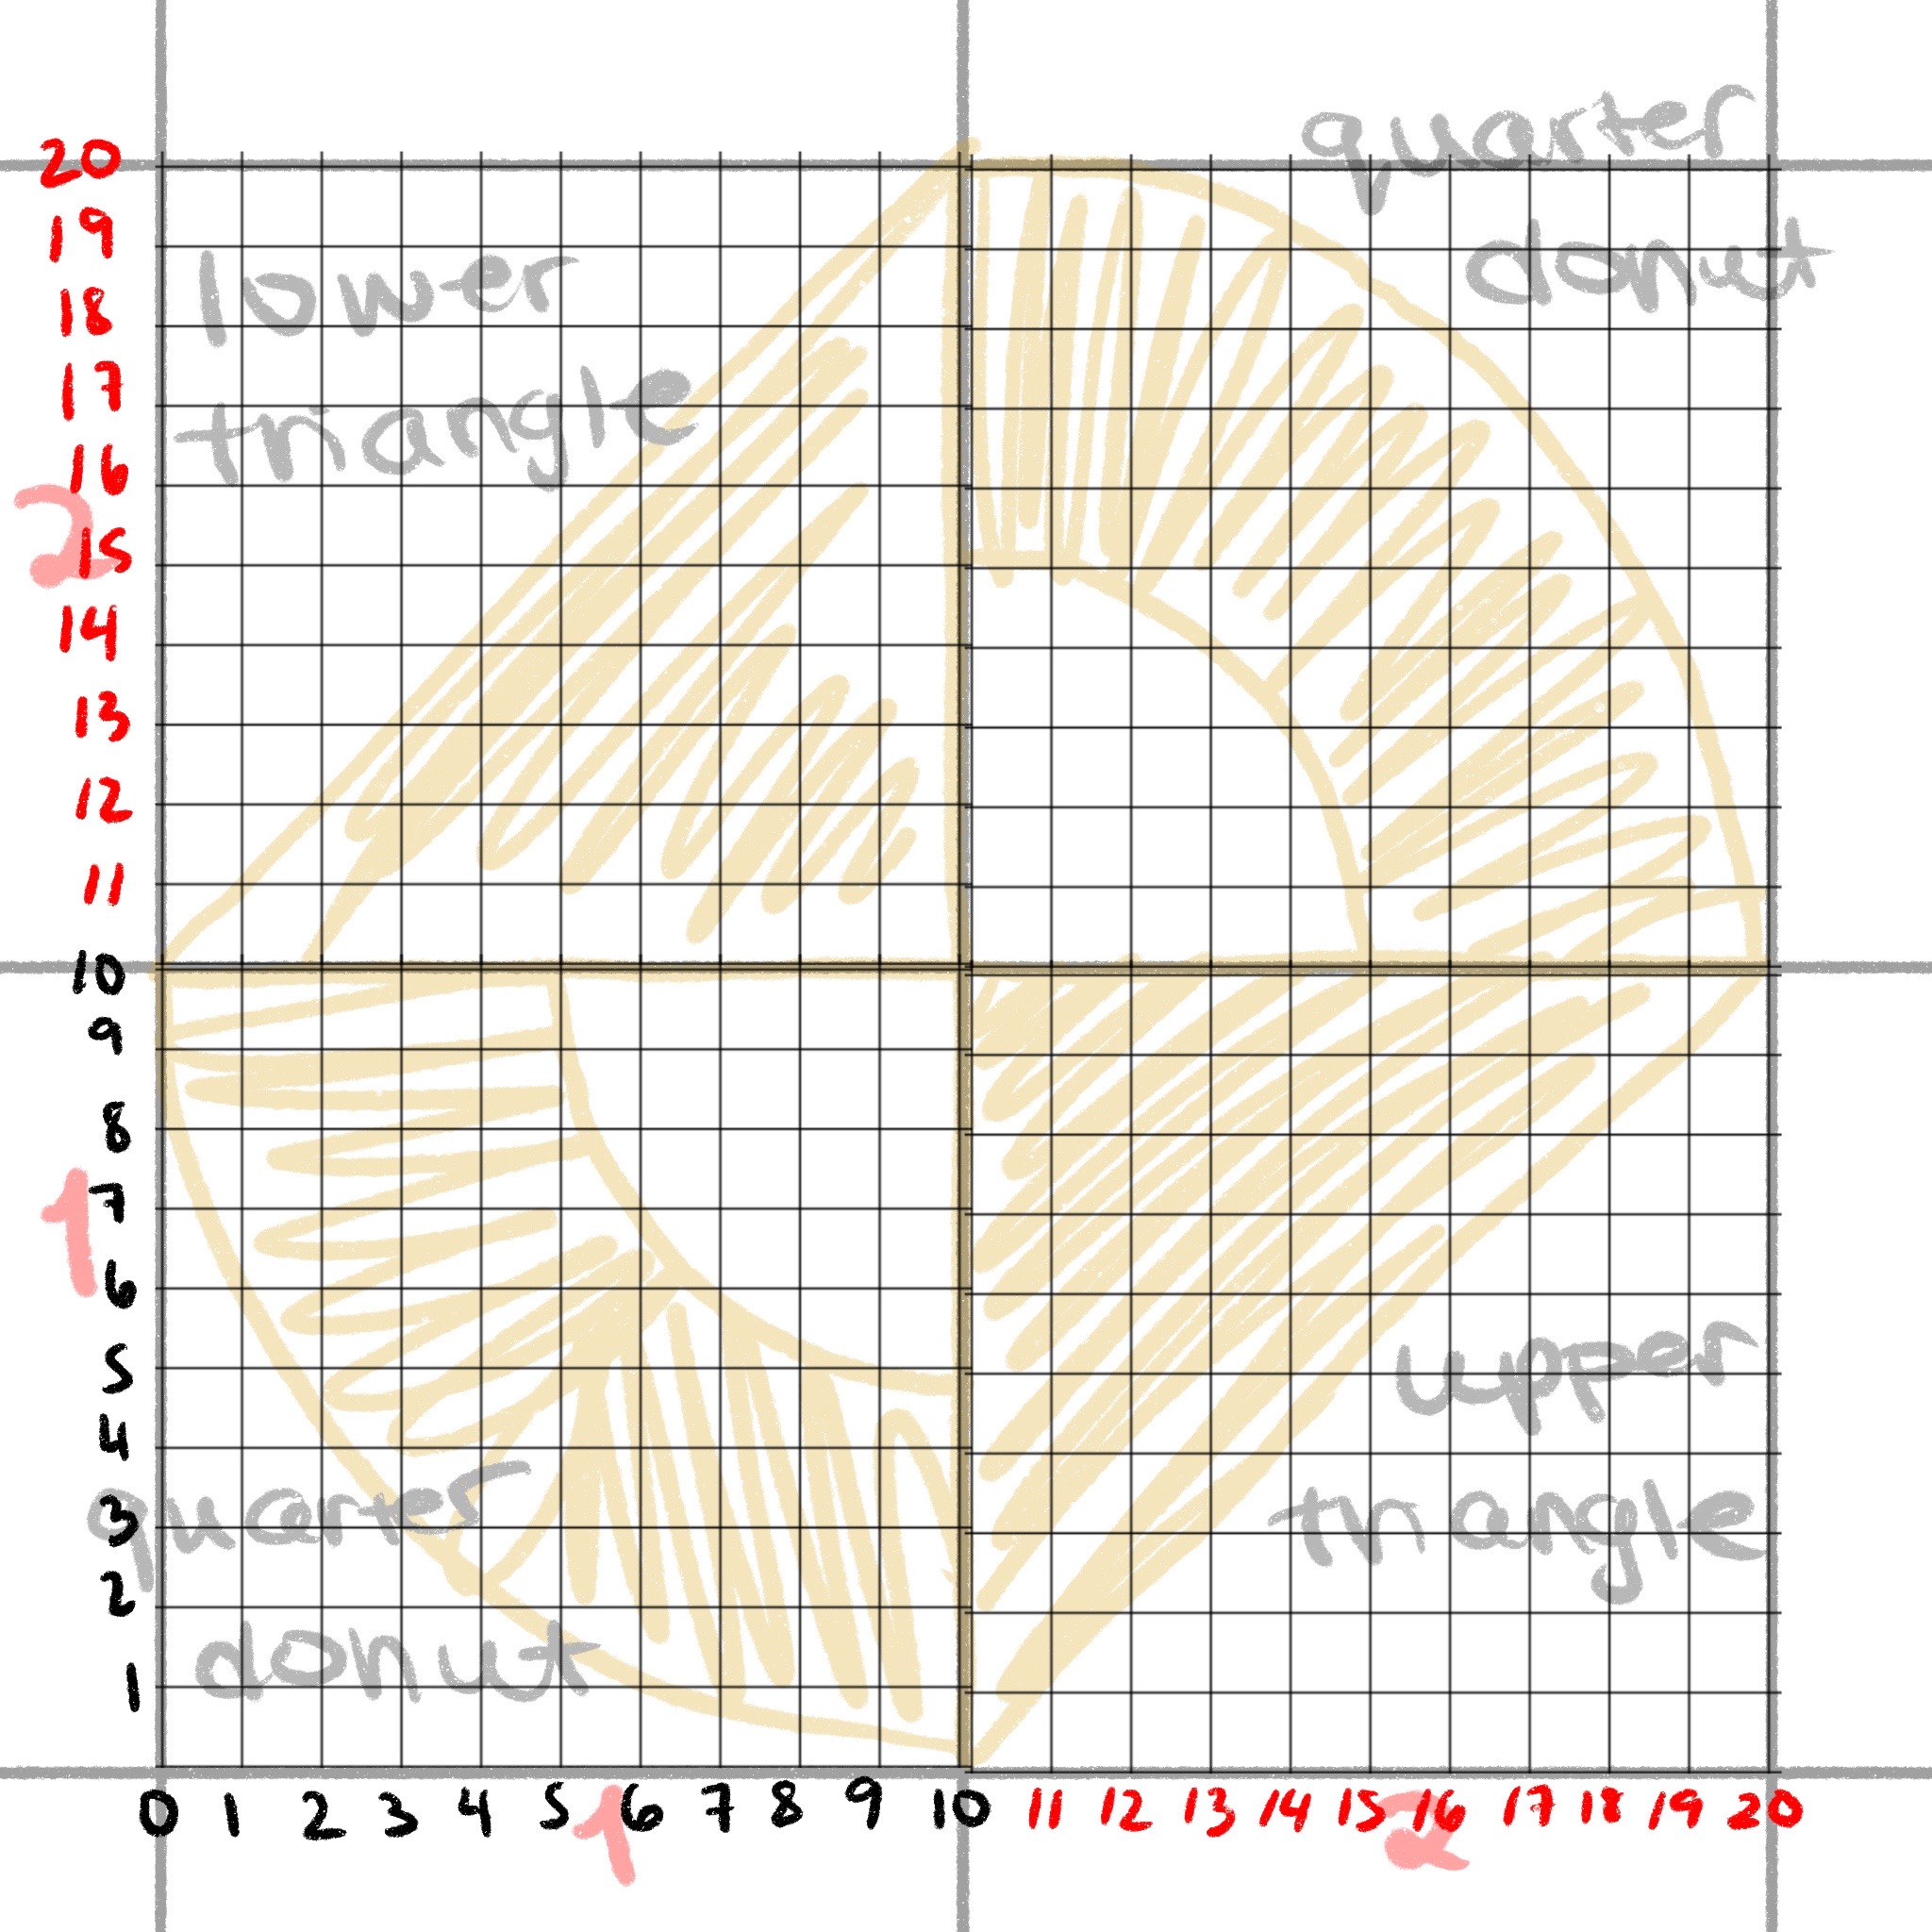
Using the shape types below, sketch two different 2x2 layers that could be combined to make a riso print
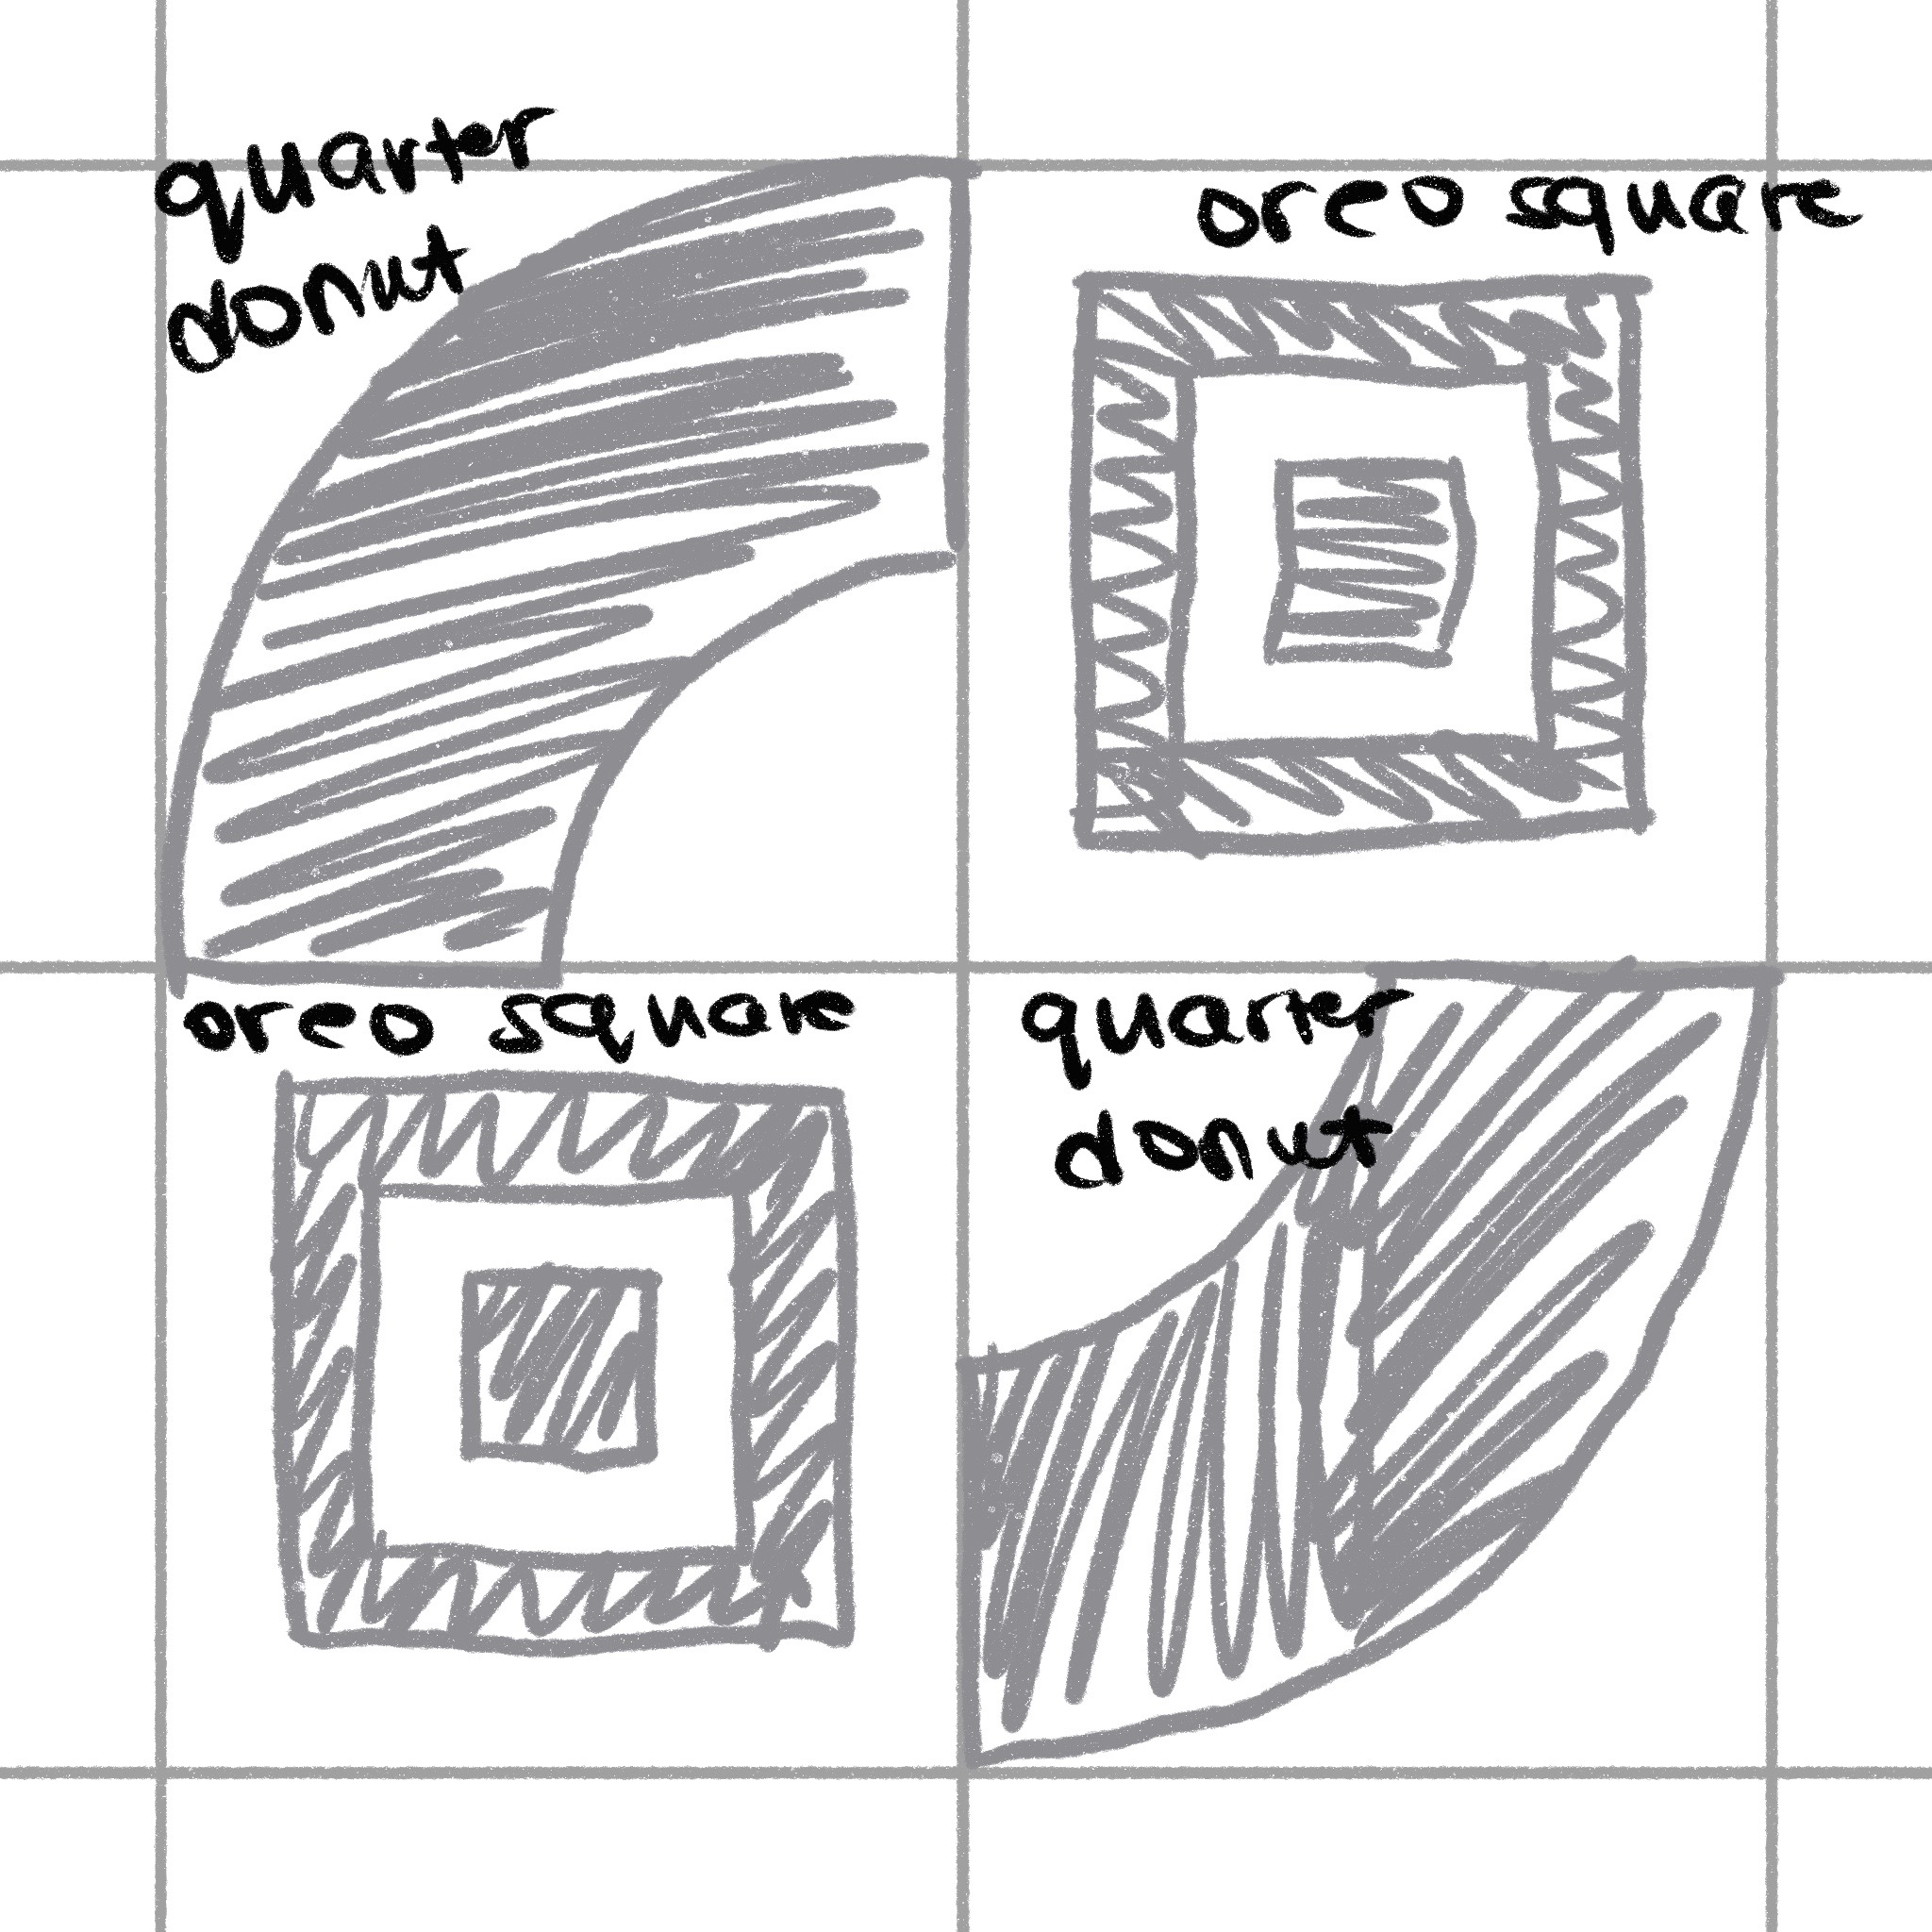
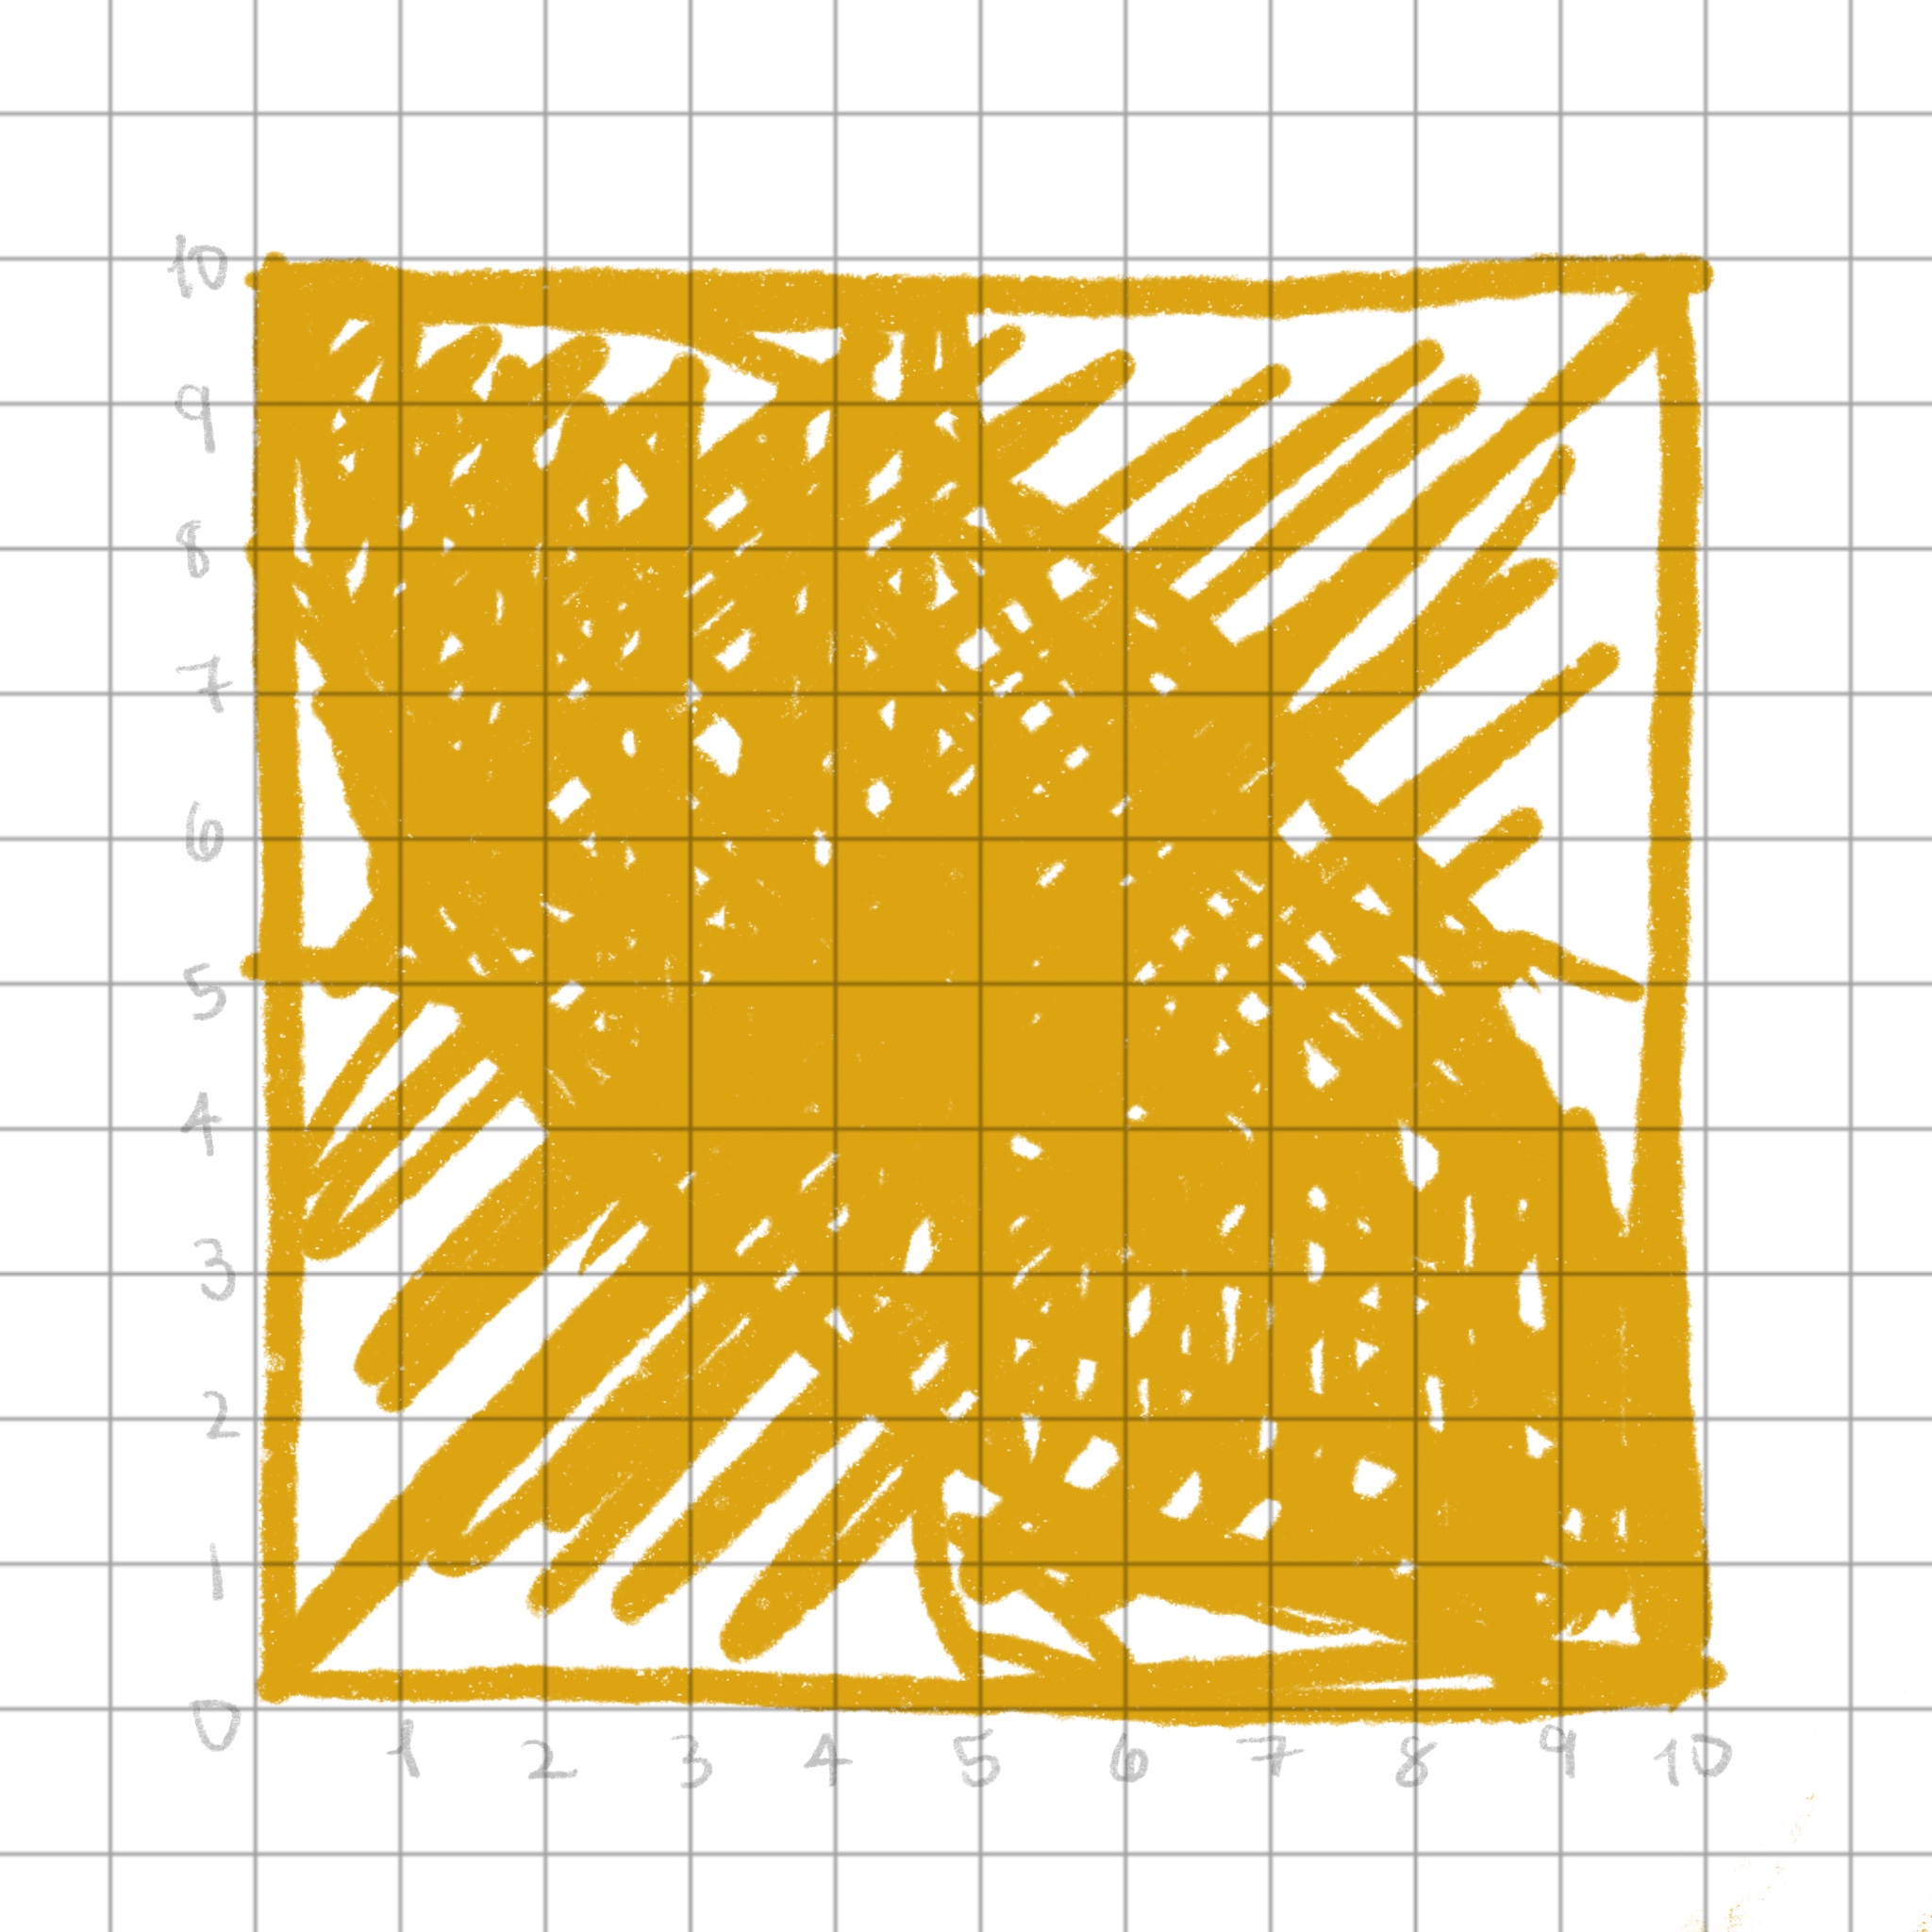
Oreo square
Oreo square
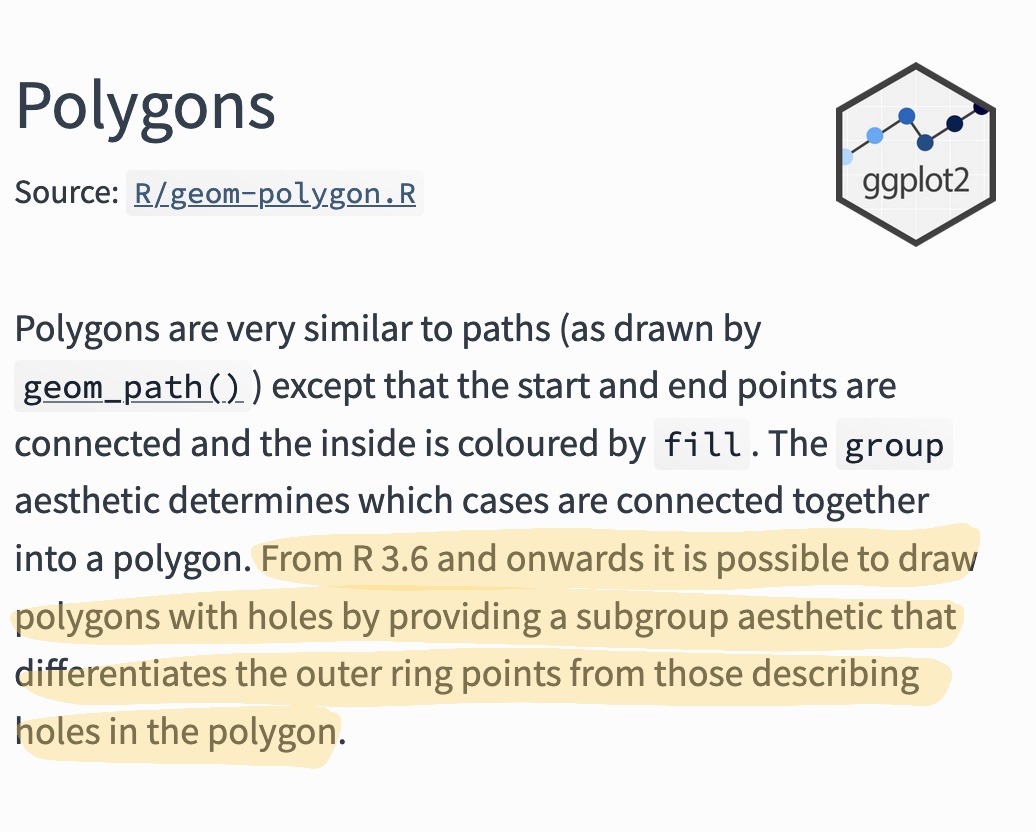
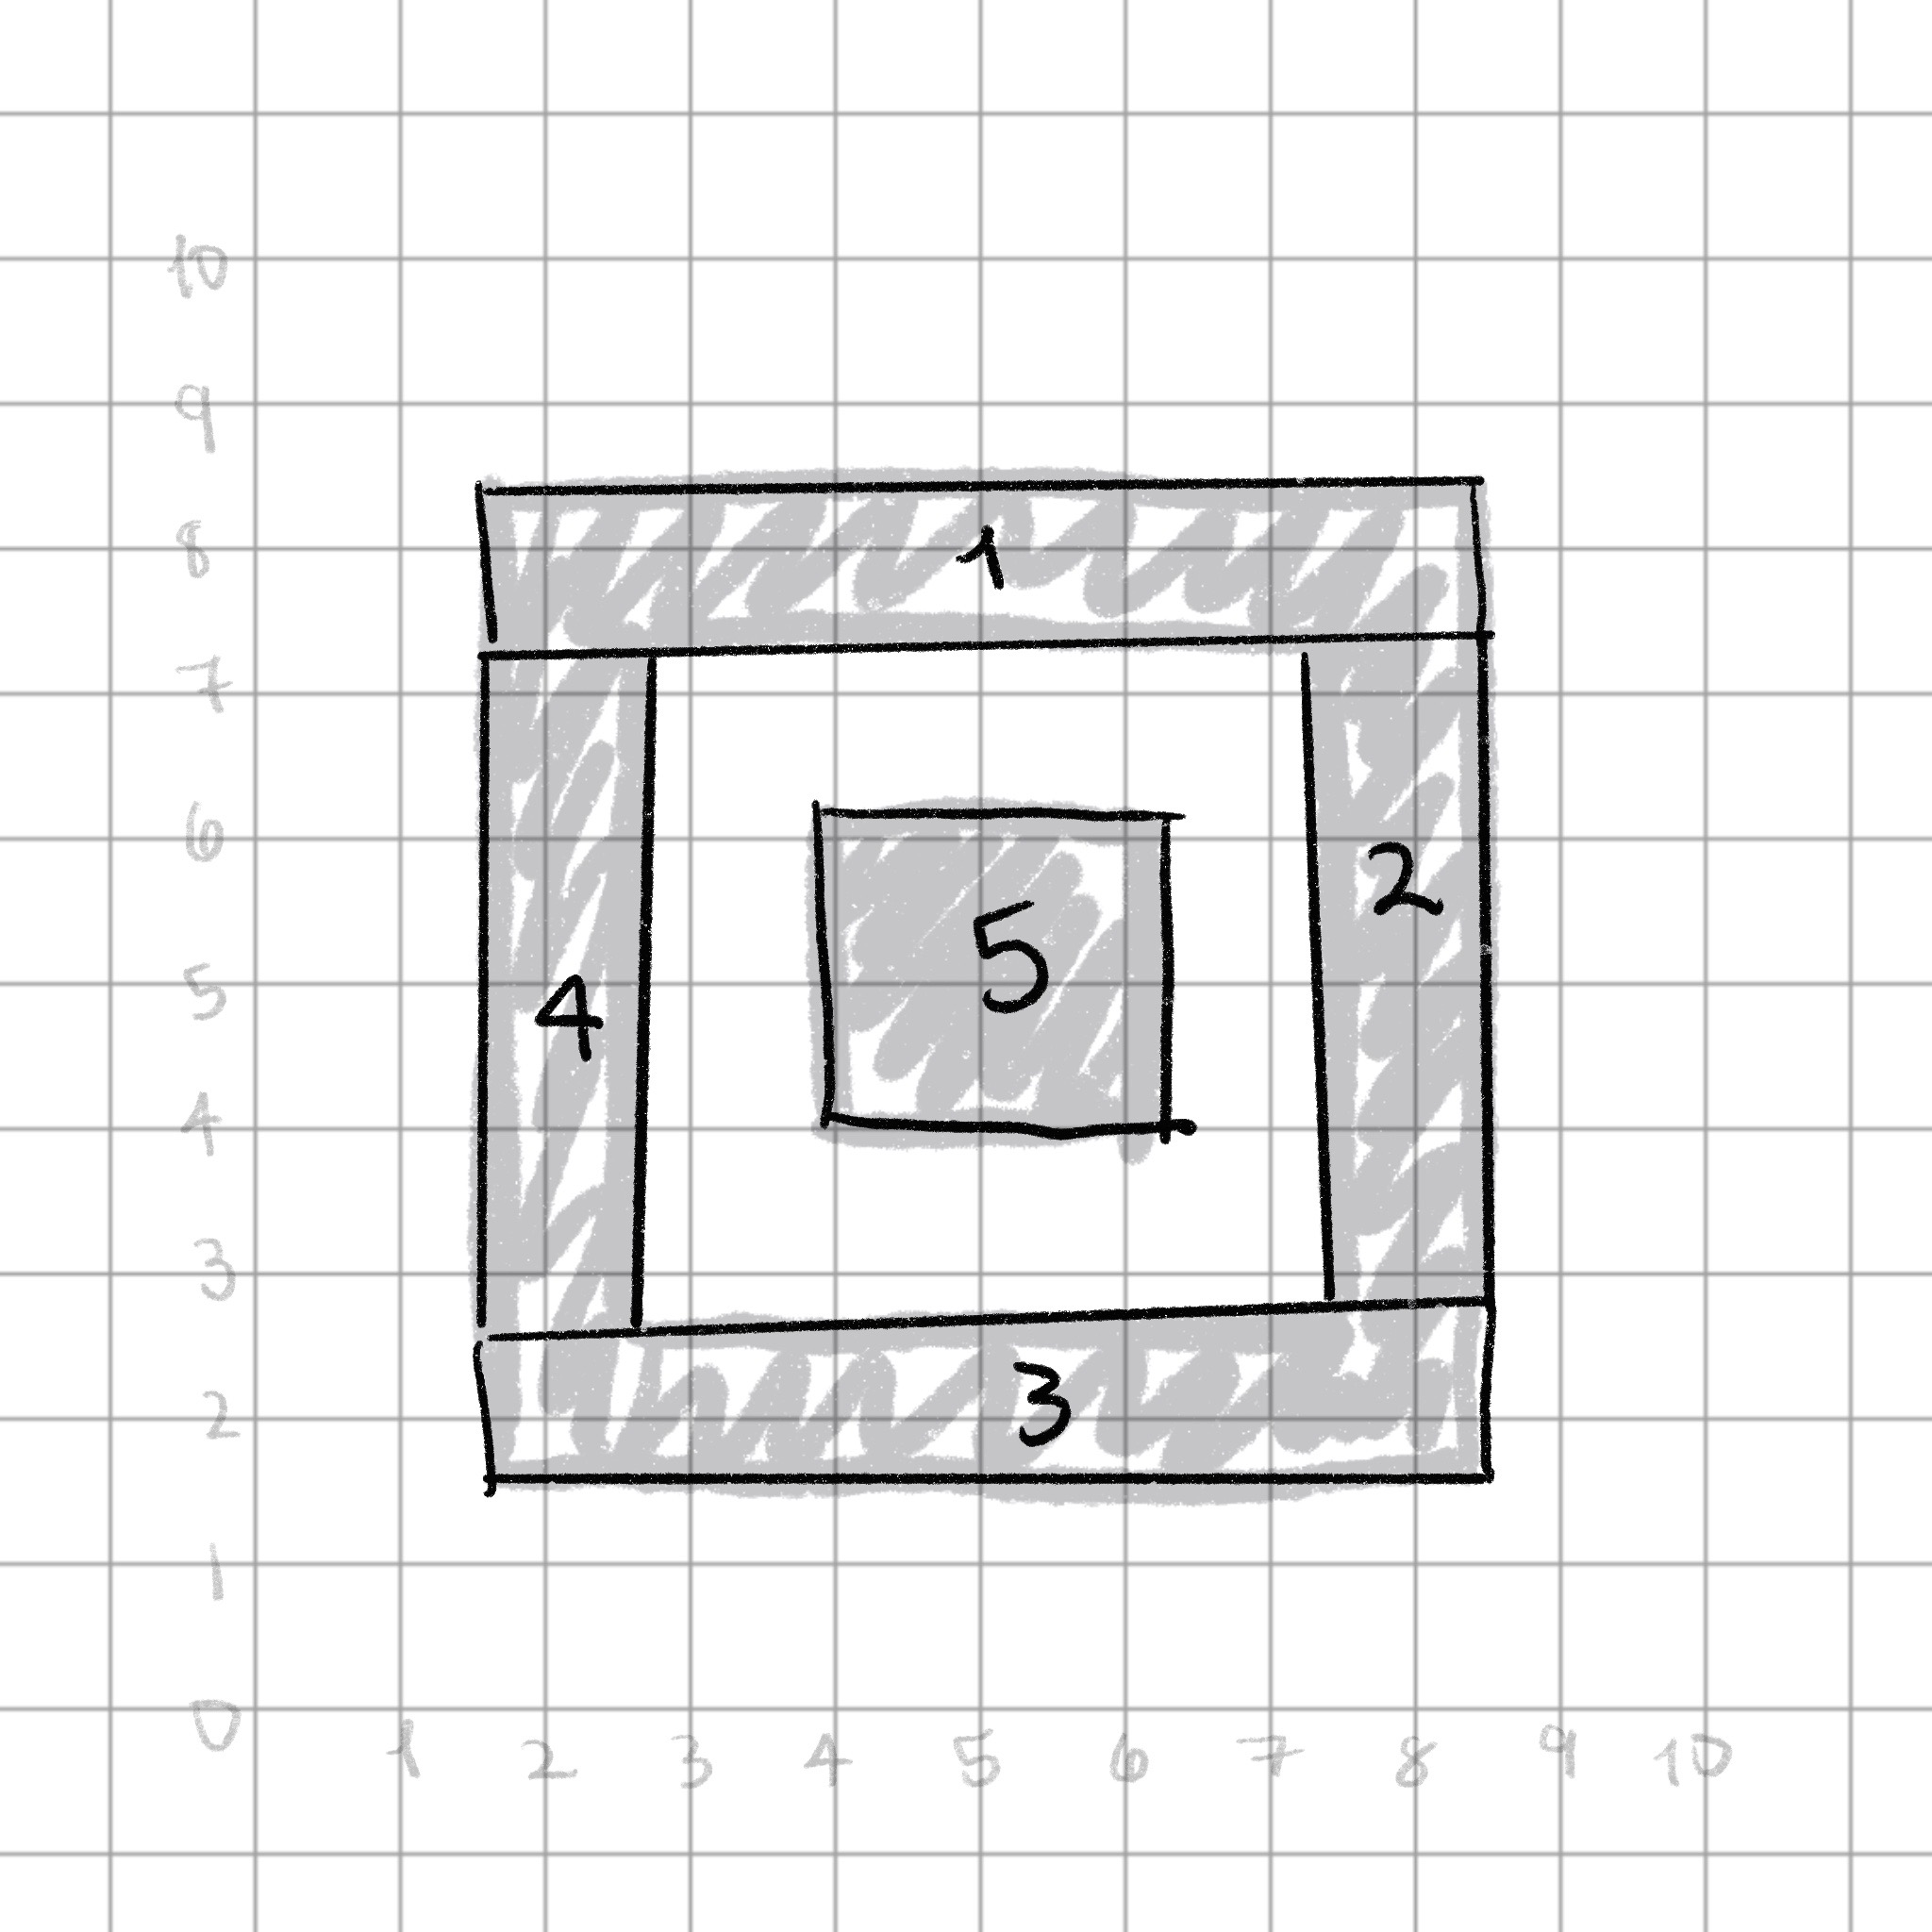
Important arguments
x,y: polygon verticesgroup: which polygon it issubgroup: to differentiate outer polygon points from holes
Oreo square
Oreo square
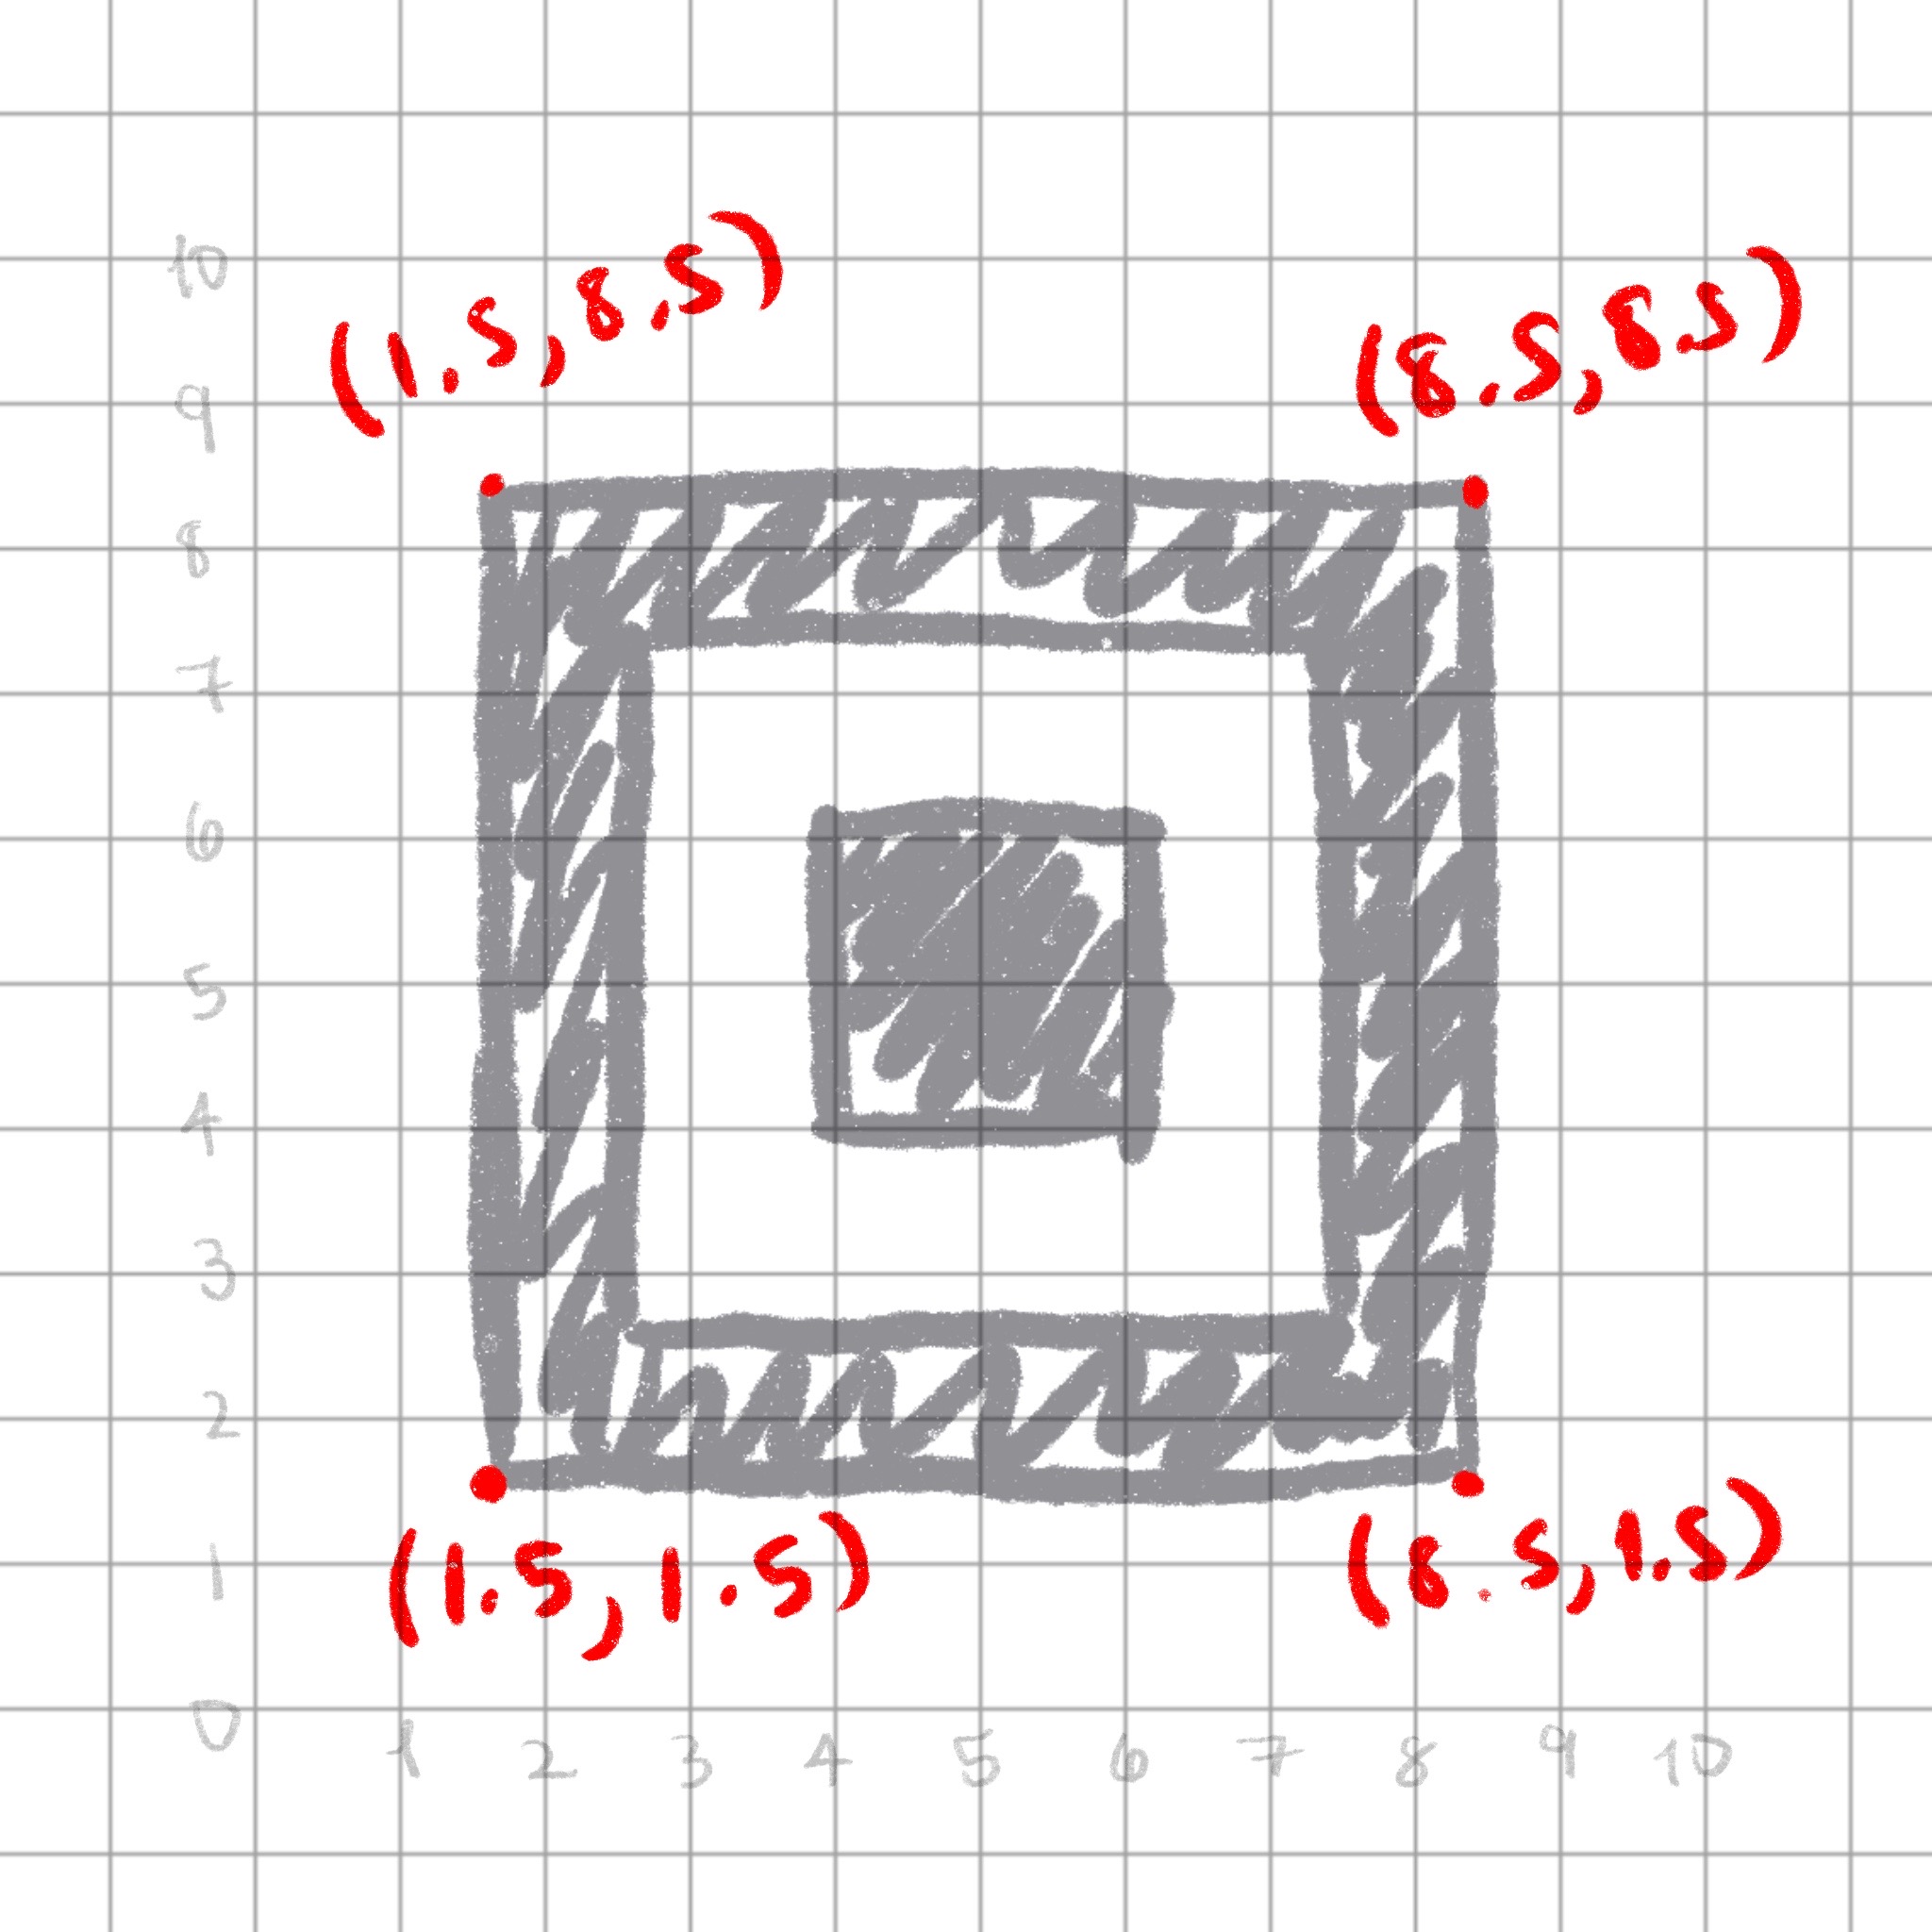
# A tibble: 8 × 3
      x     y subgroup
  <dbl> <dbl>    <dbl>
1  1.5   1.5         1
2  8.5   1.5         1
3  8.5   8.5         1
4  1.5   8.5         1
5  2.75  2.75        2
6  7.25  2.75        2
7  7.25  7.25        2
8  2.75  7.25        2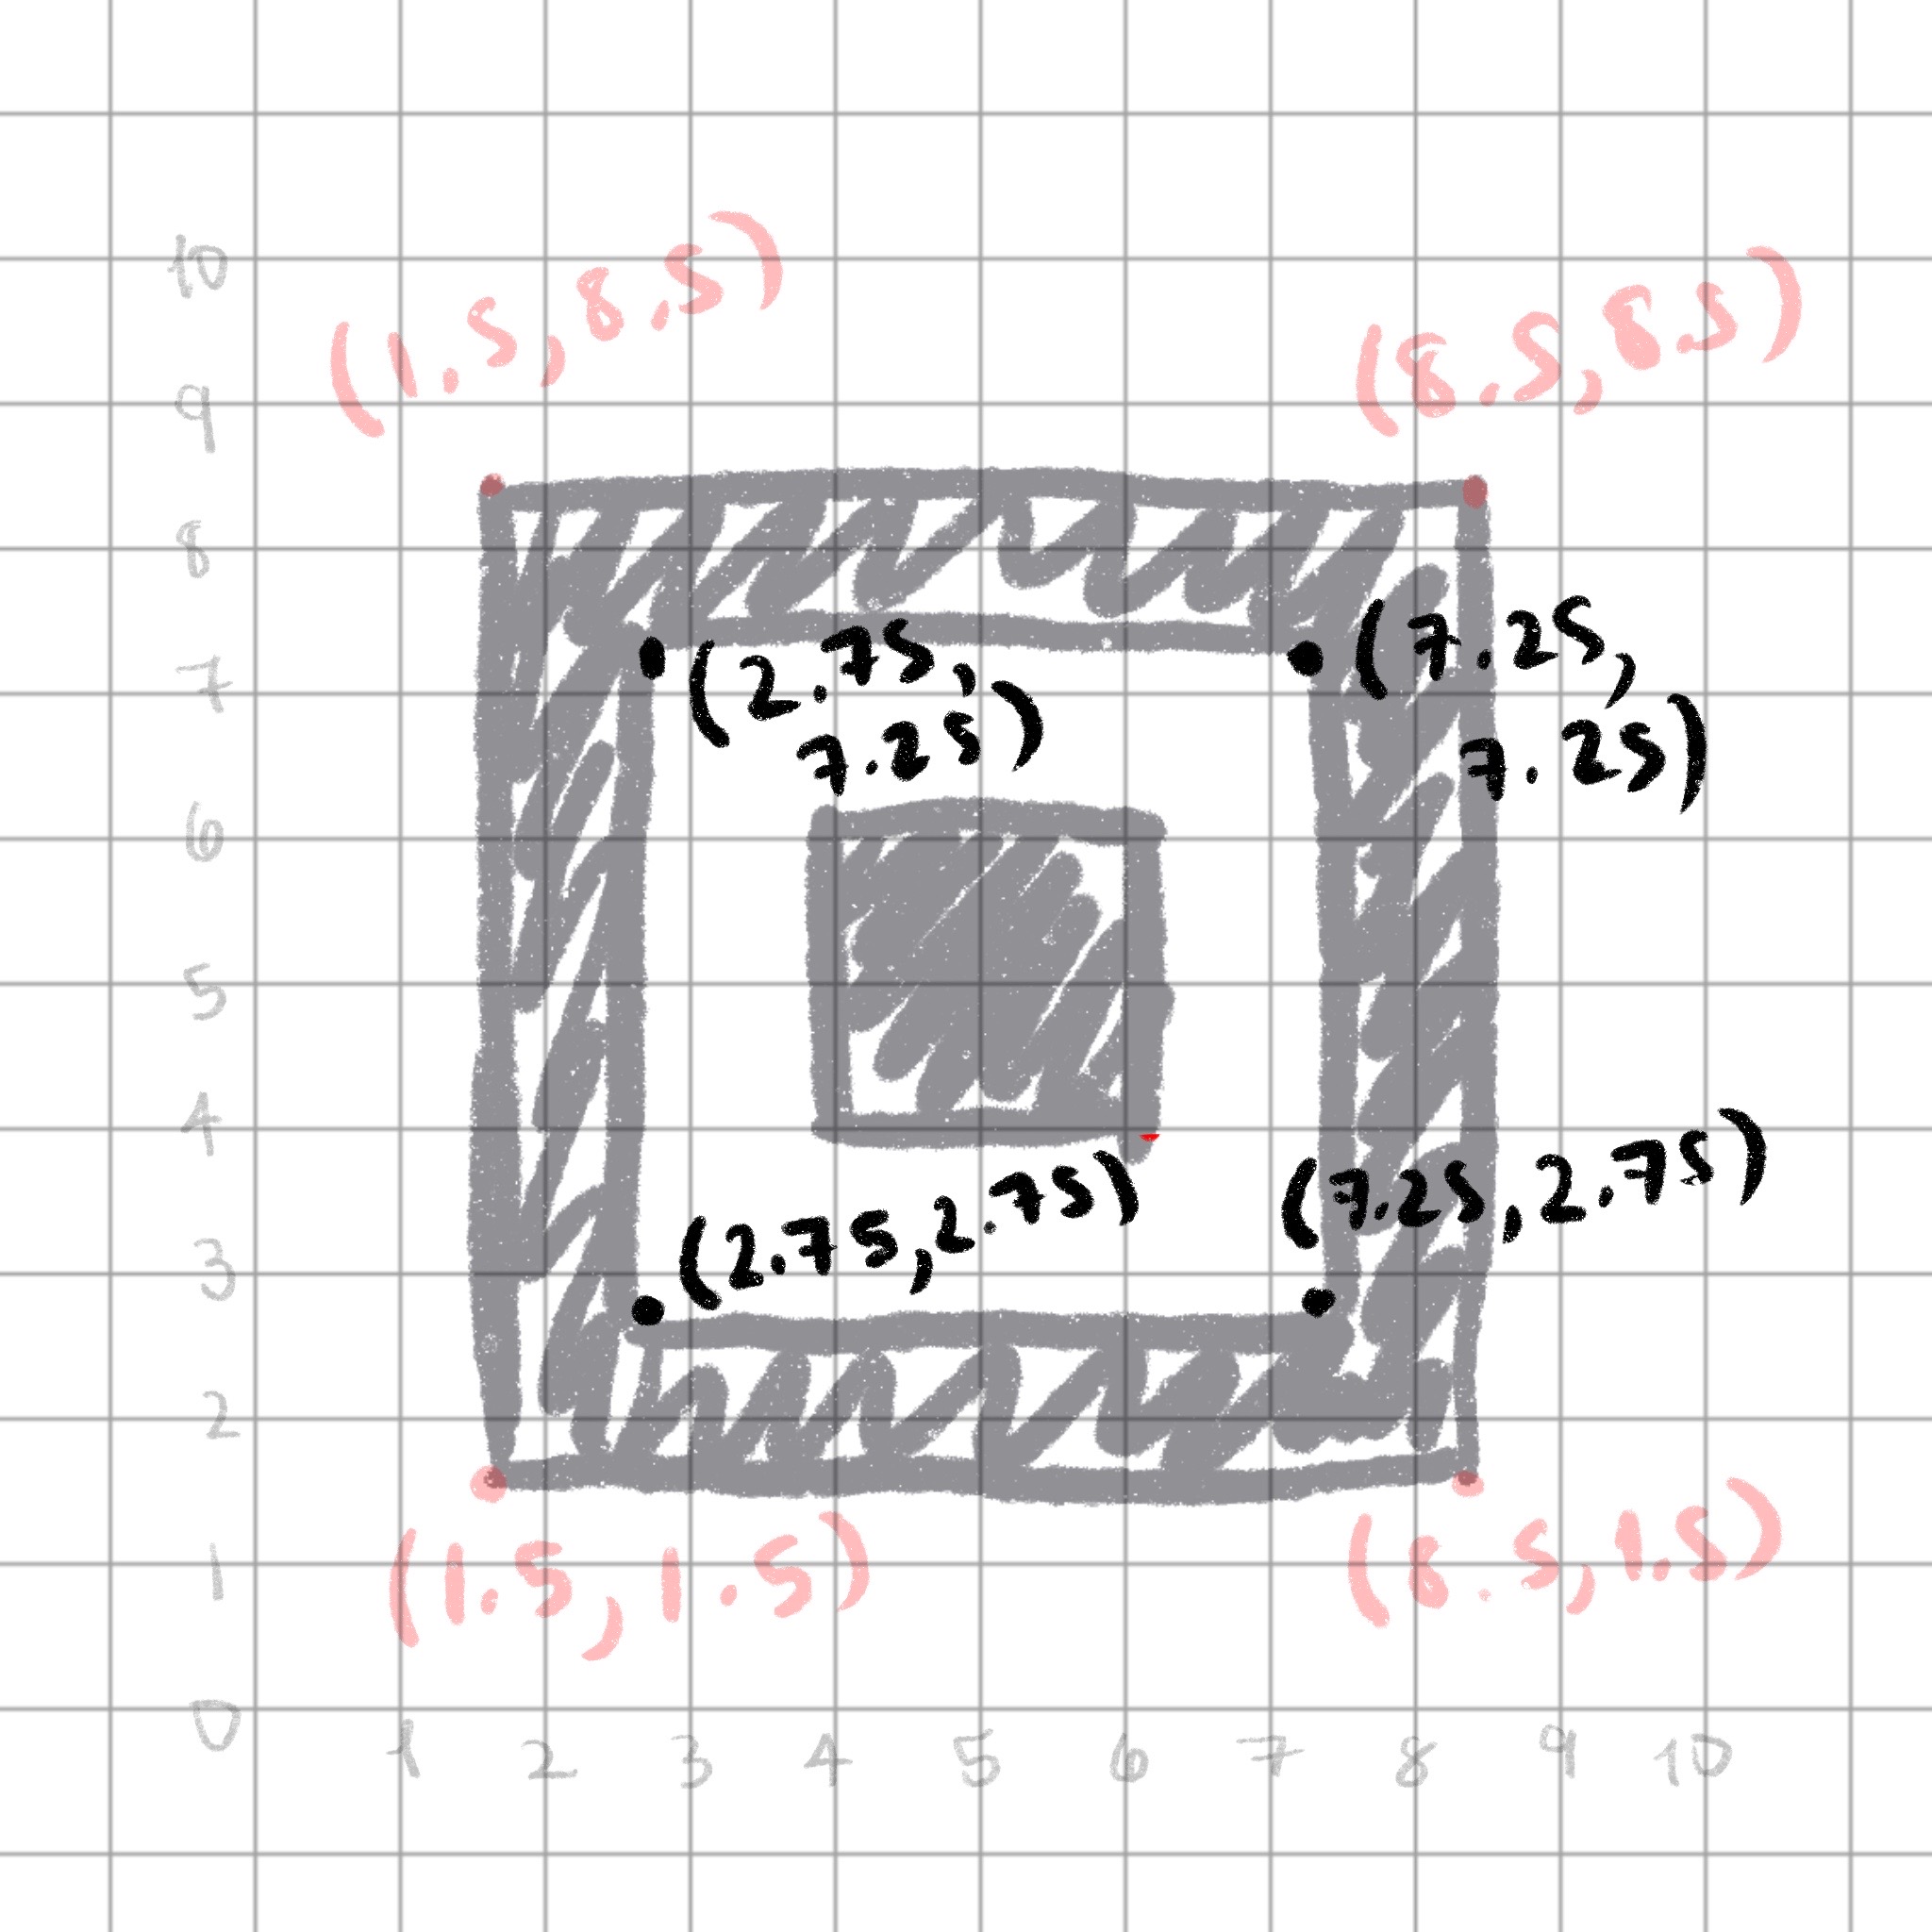
Oreo square
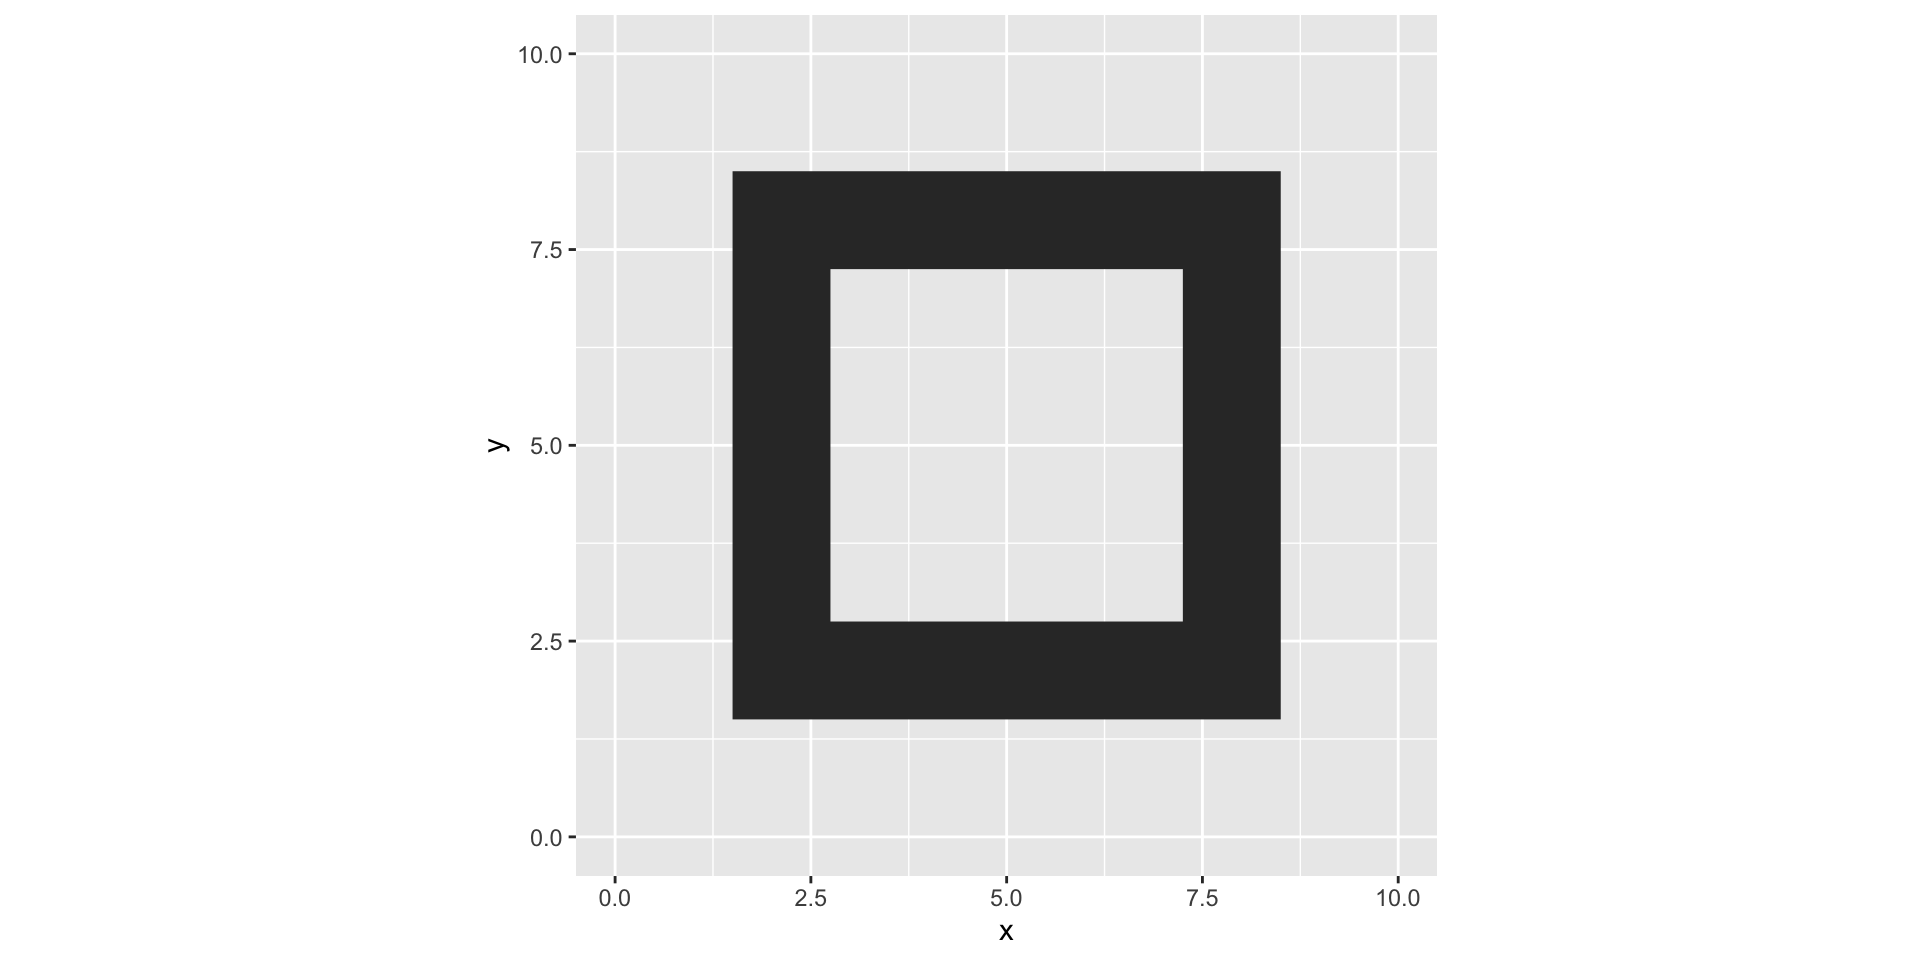
Oreo square

Oreo square
# A tibble: 12 × 4
       x     y subgroup group
   <dbl> <dbl>    <dbl> <dbl>
 1  1.5   1.5         1     1
 2  8.5   1.5         1     1
 3  8.5   8.5         1     1
 4  1.5   8.5         1     1
 5  2.75  2.75        2     1
 6  7.25  2.75        2     1
 7  7.25  7.25        2     1
 8  2.75  7.25        2     1
 9  4     4          NA     2
10  6     4          NA     2
11  6     6          NA     2
12  4     6          NA     2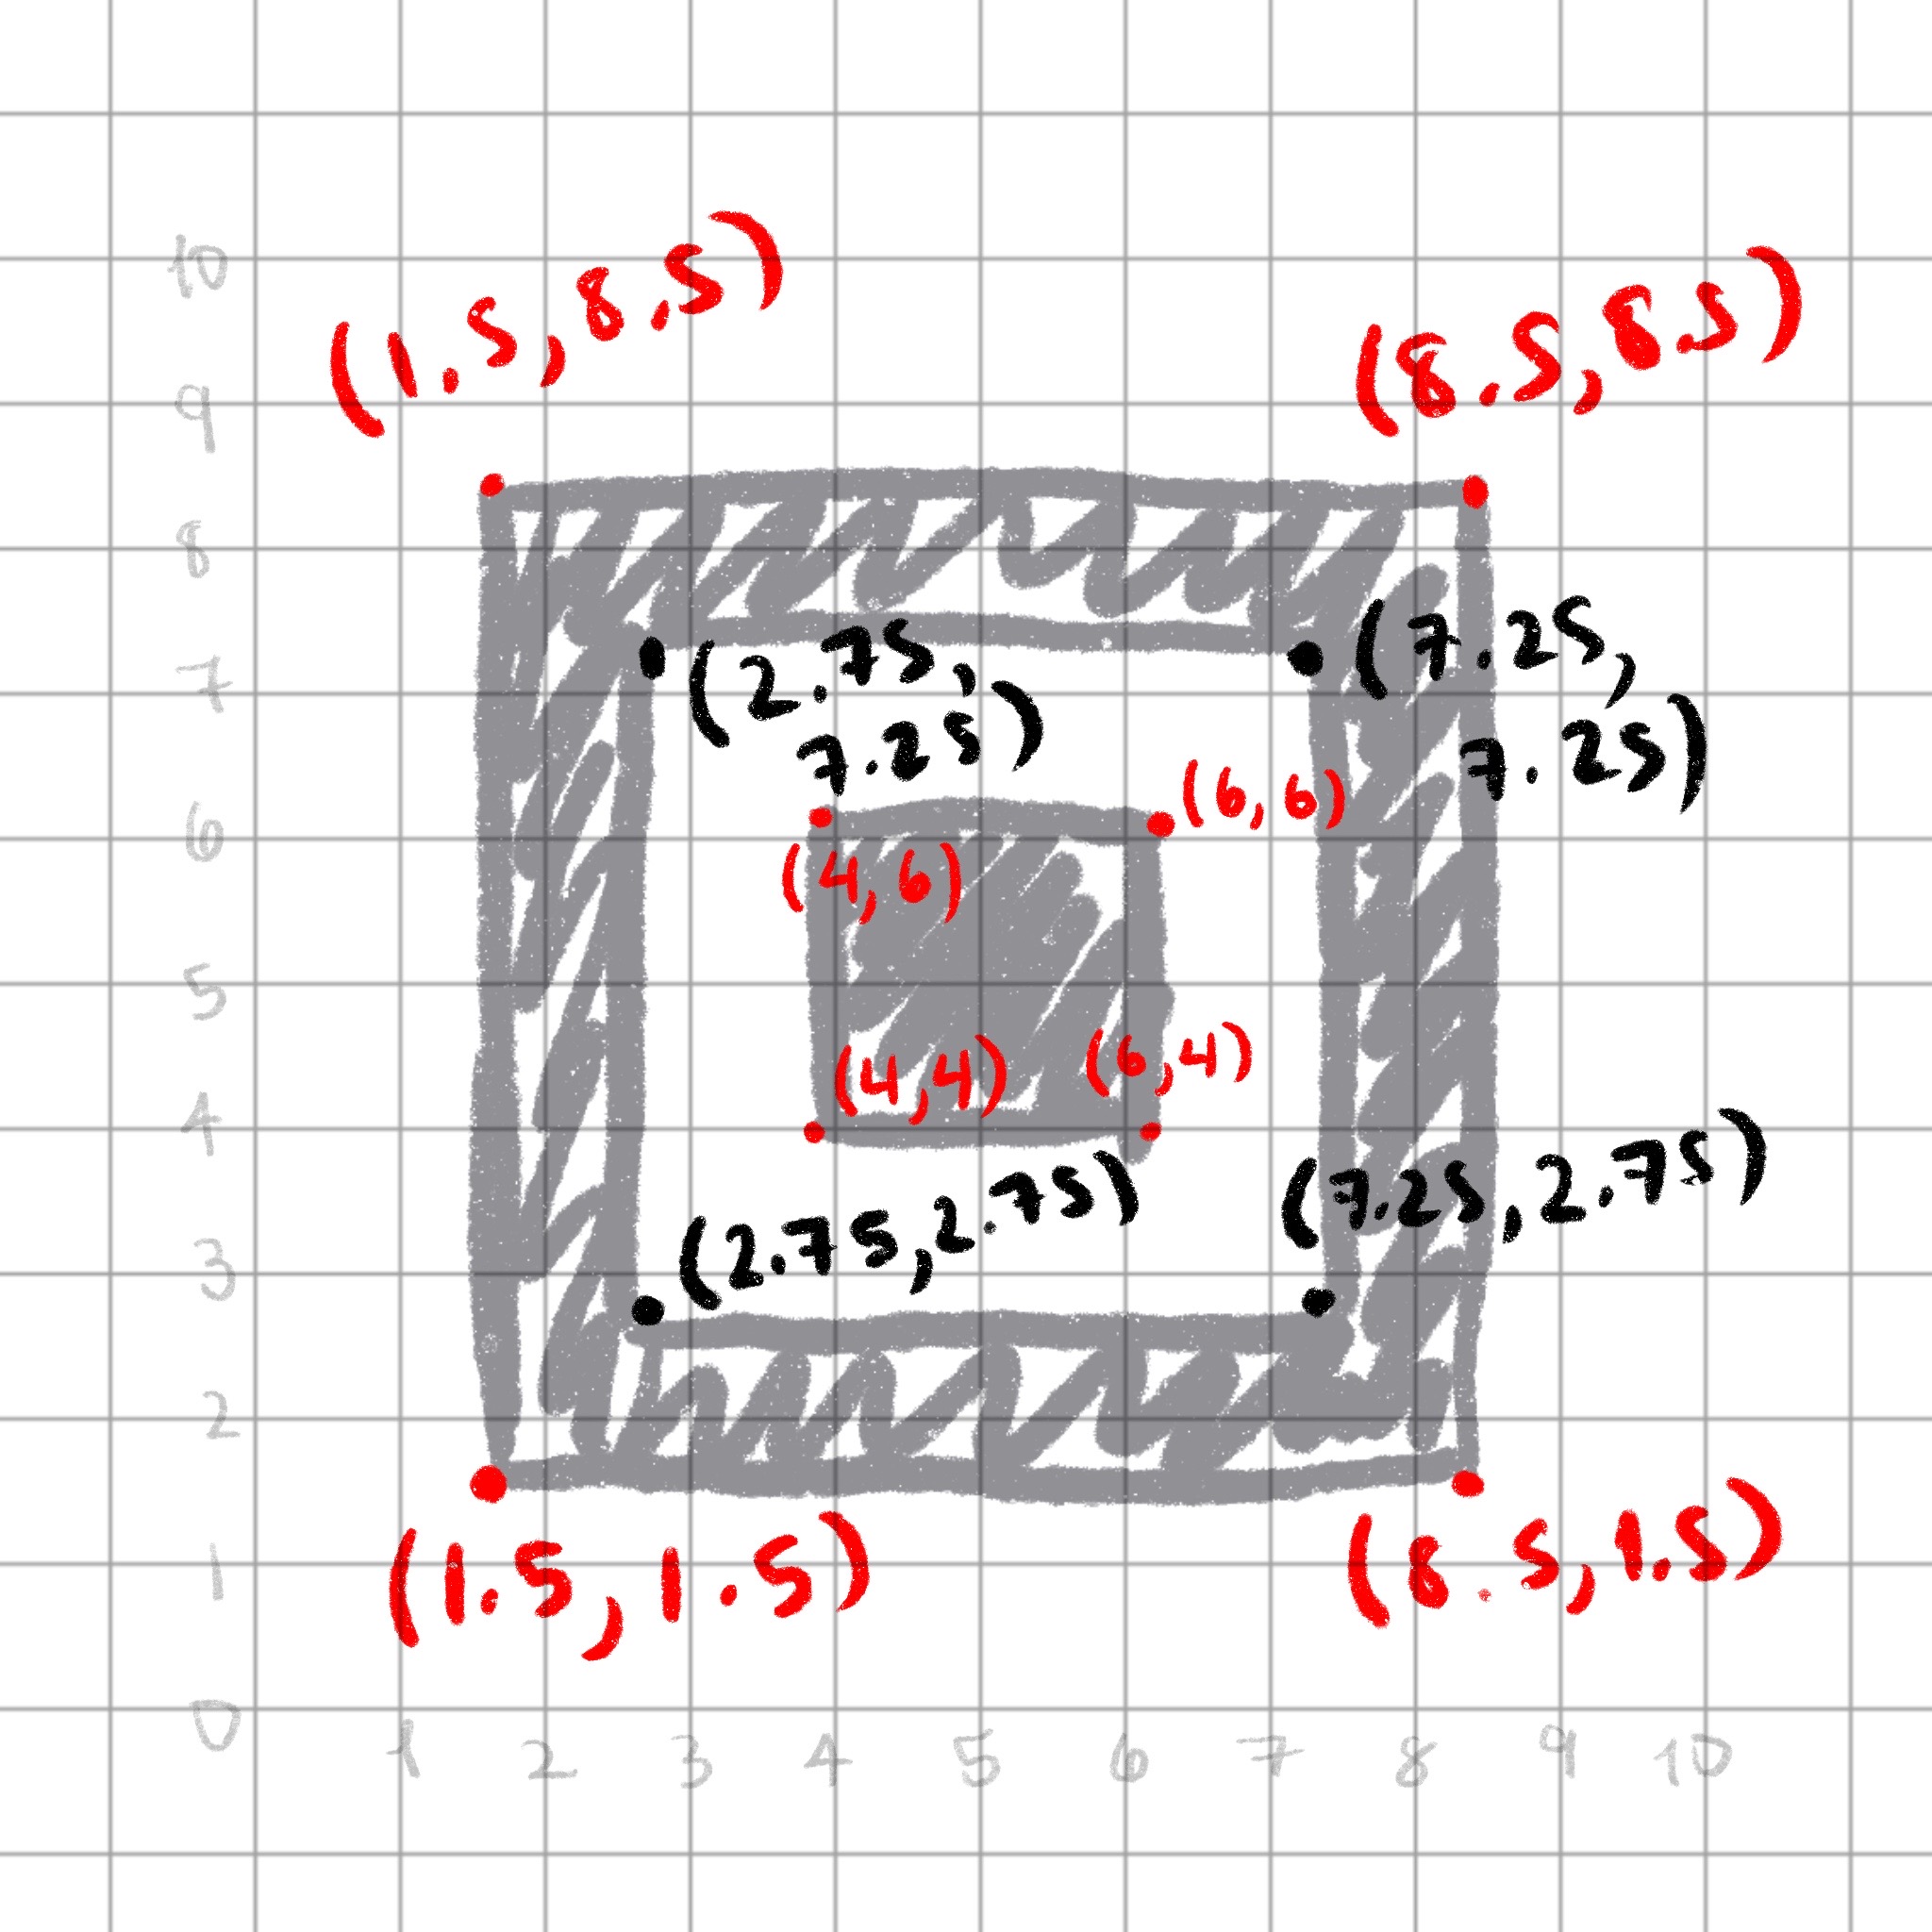
Oreo square

Oreo square

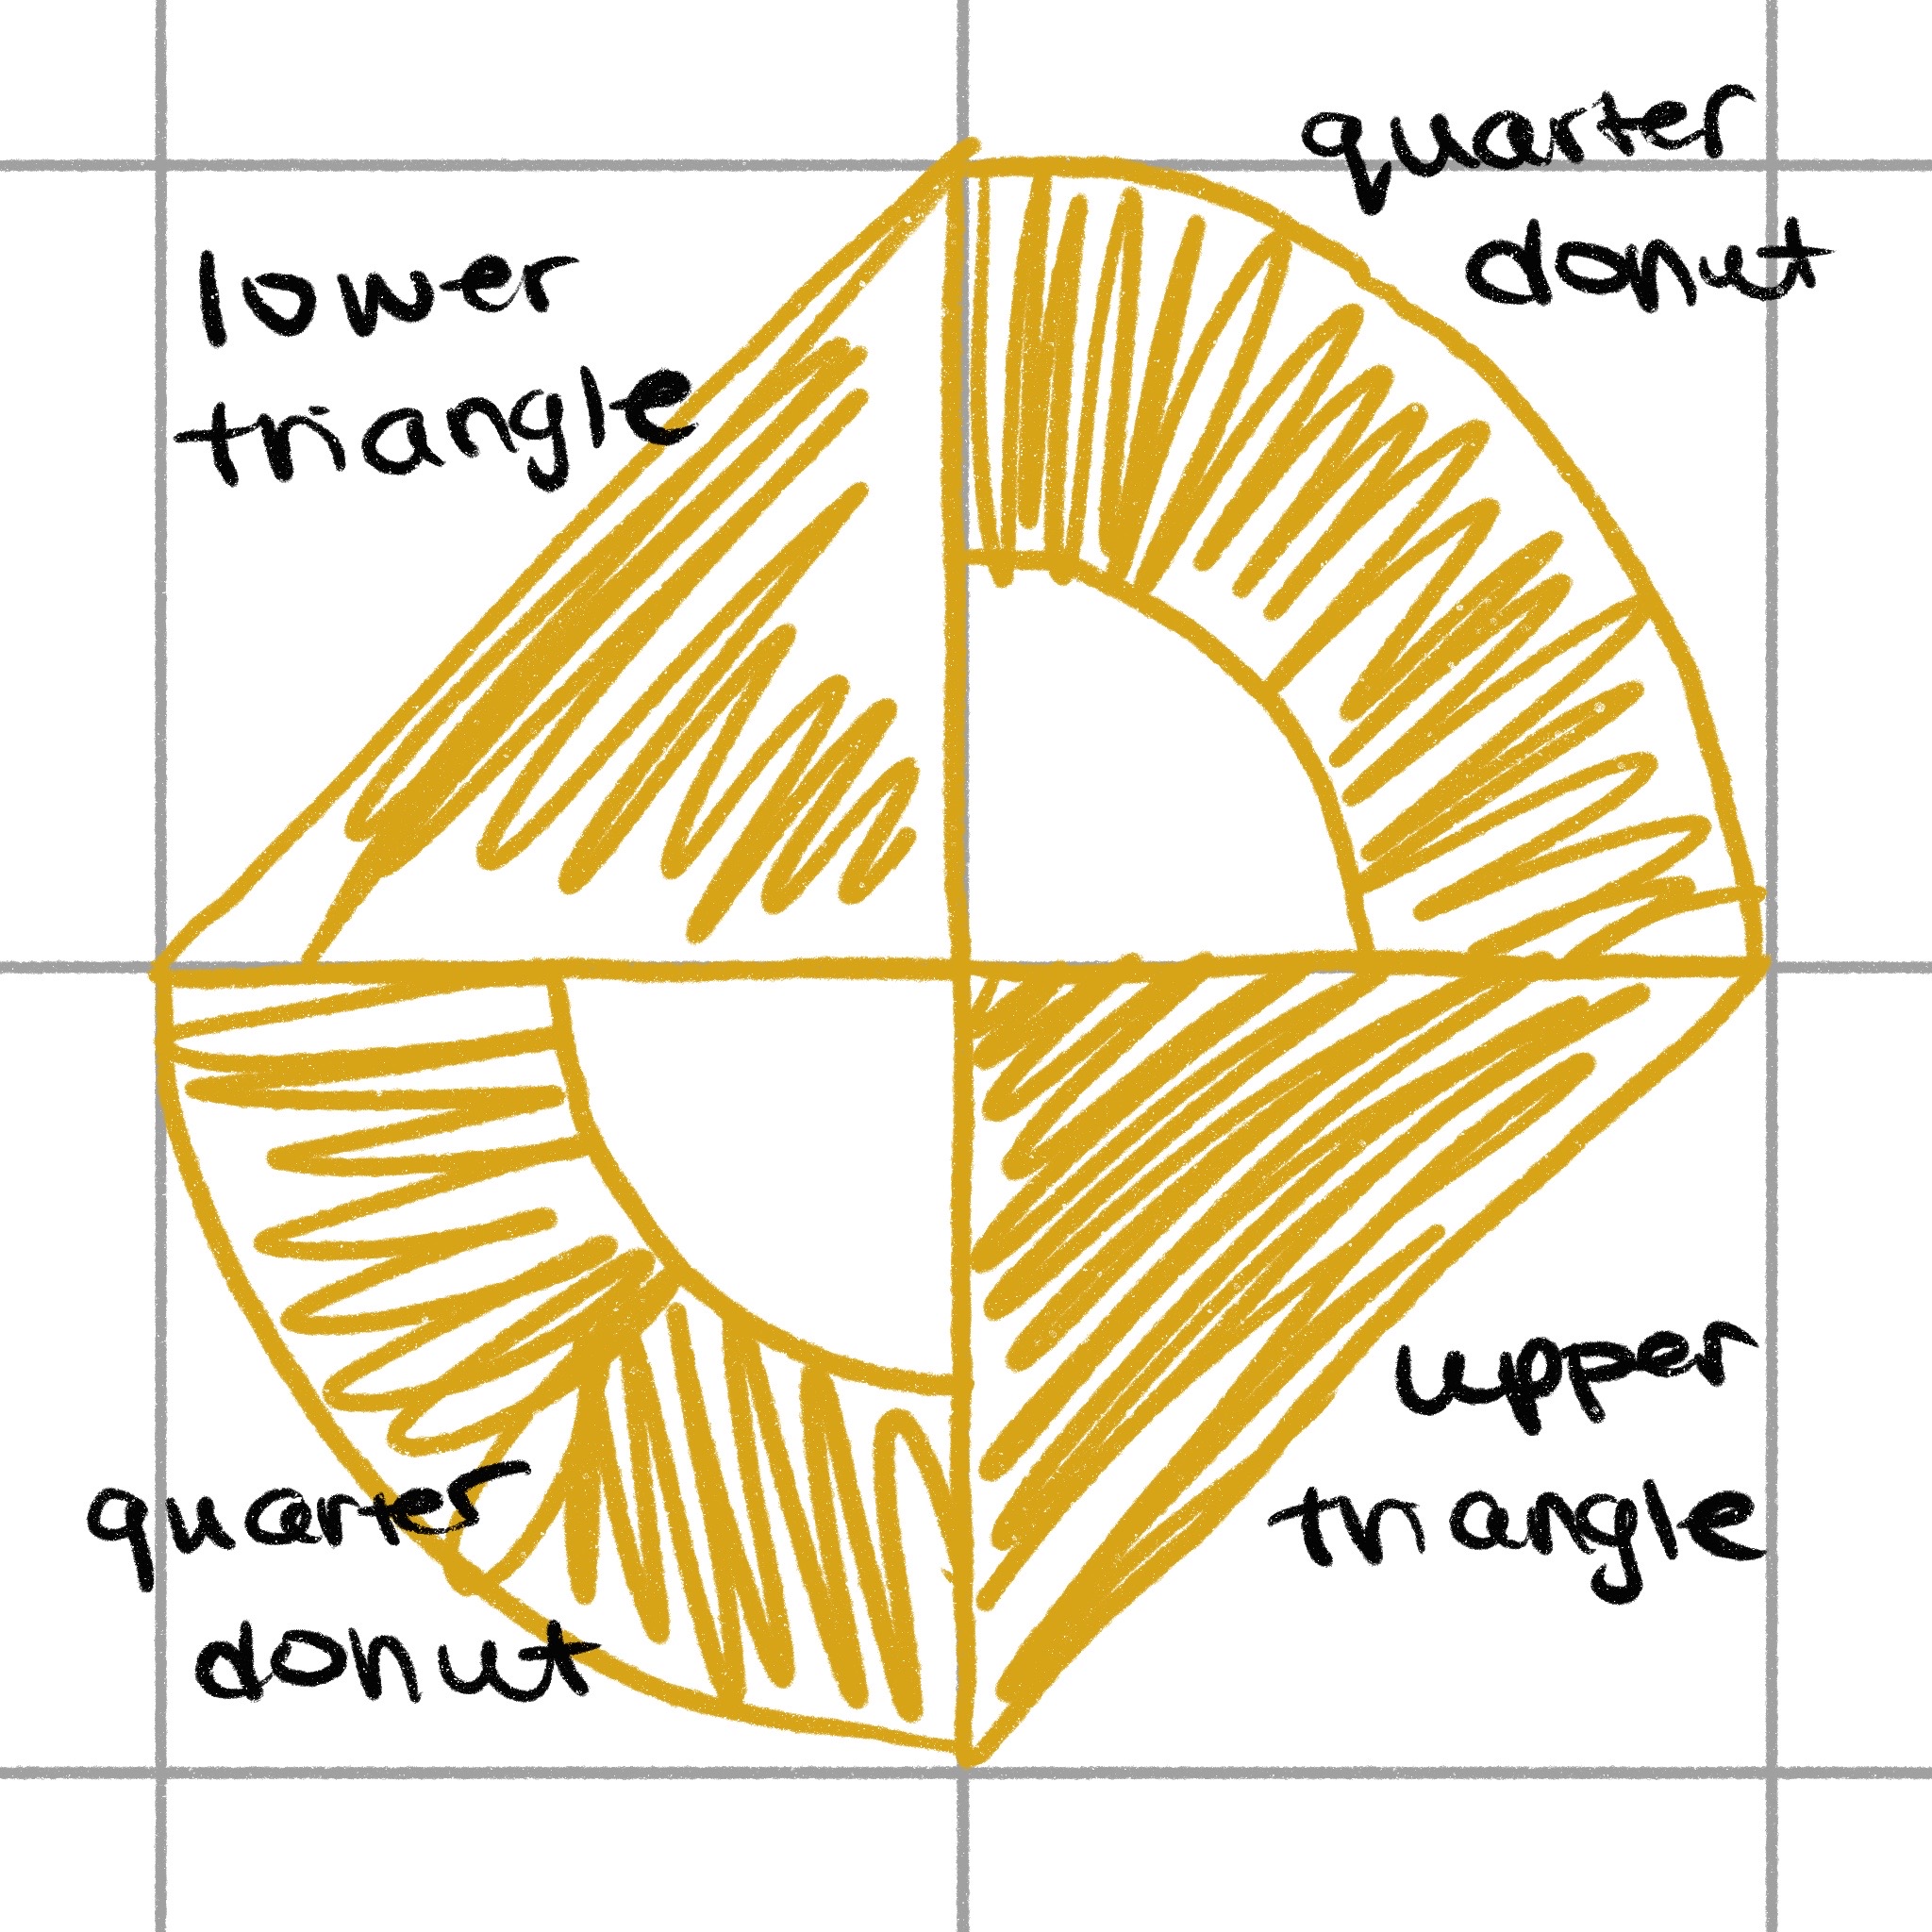
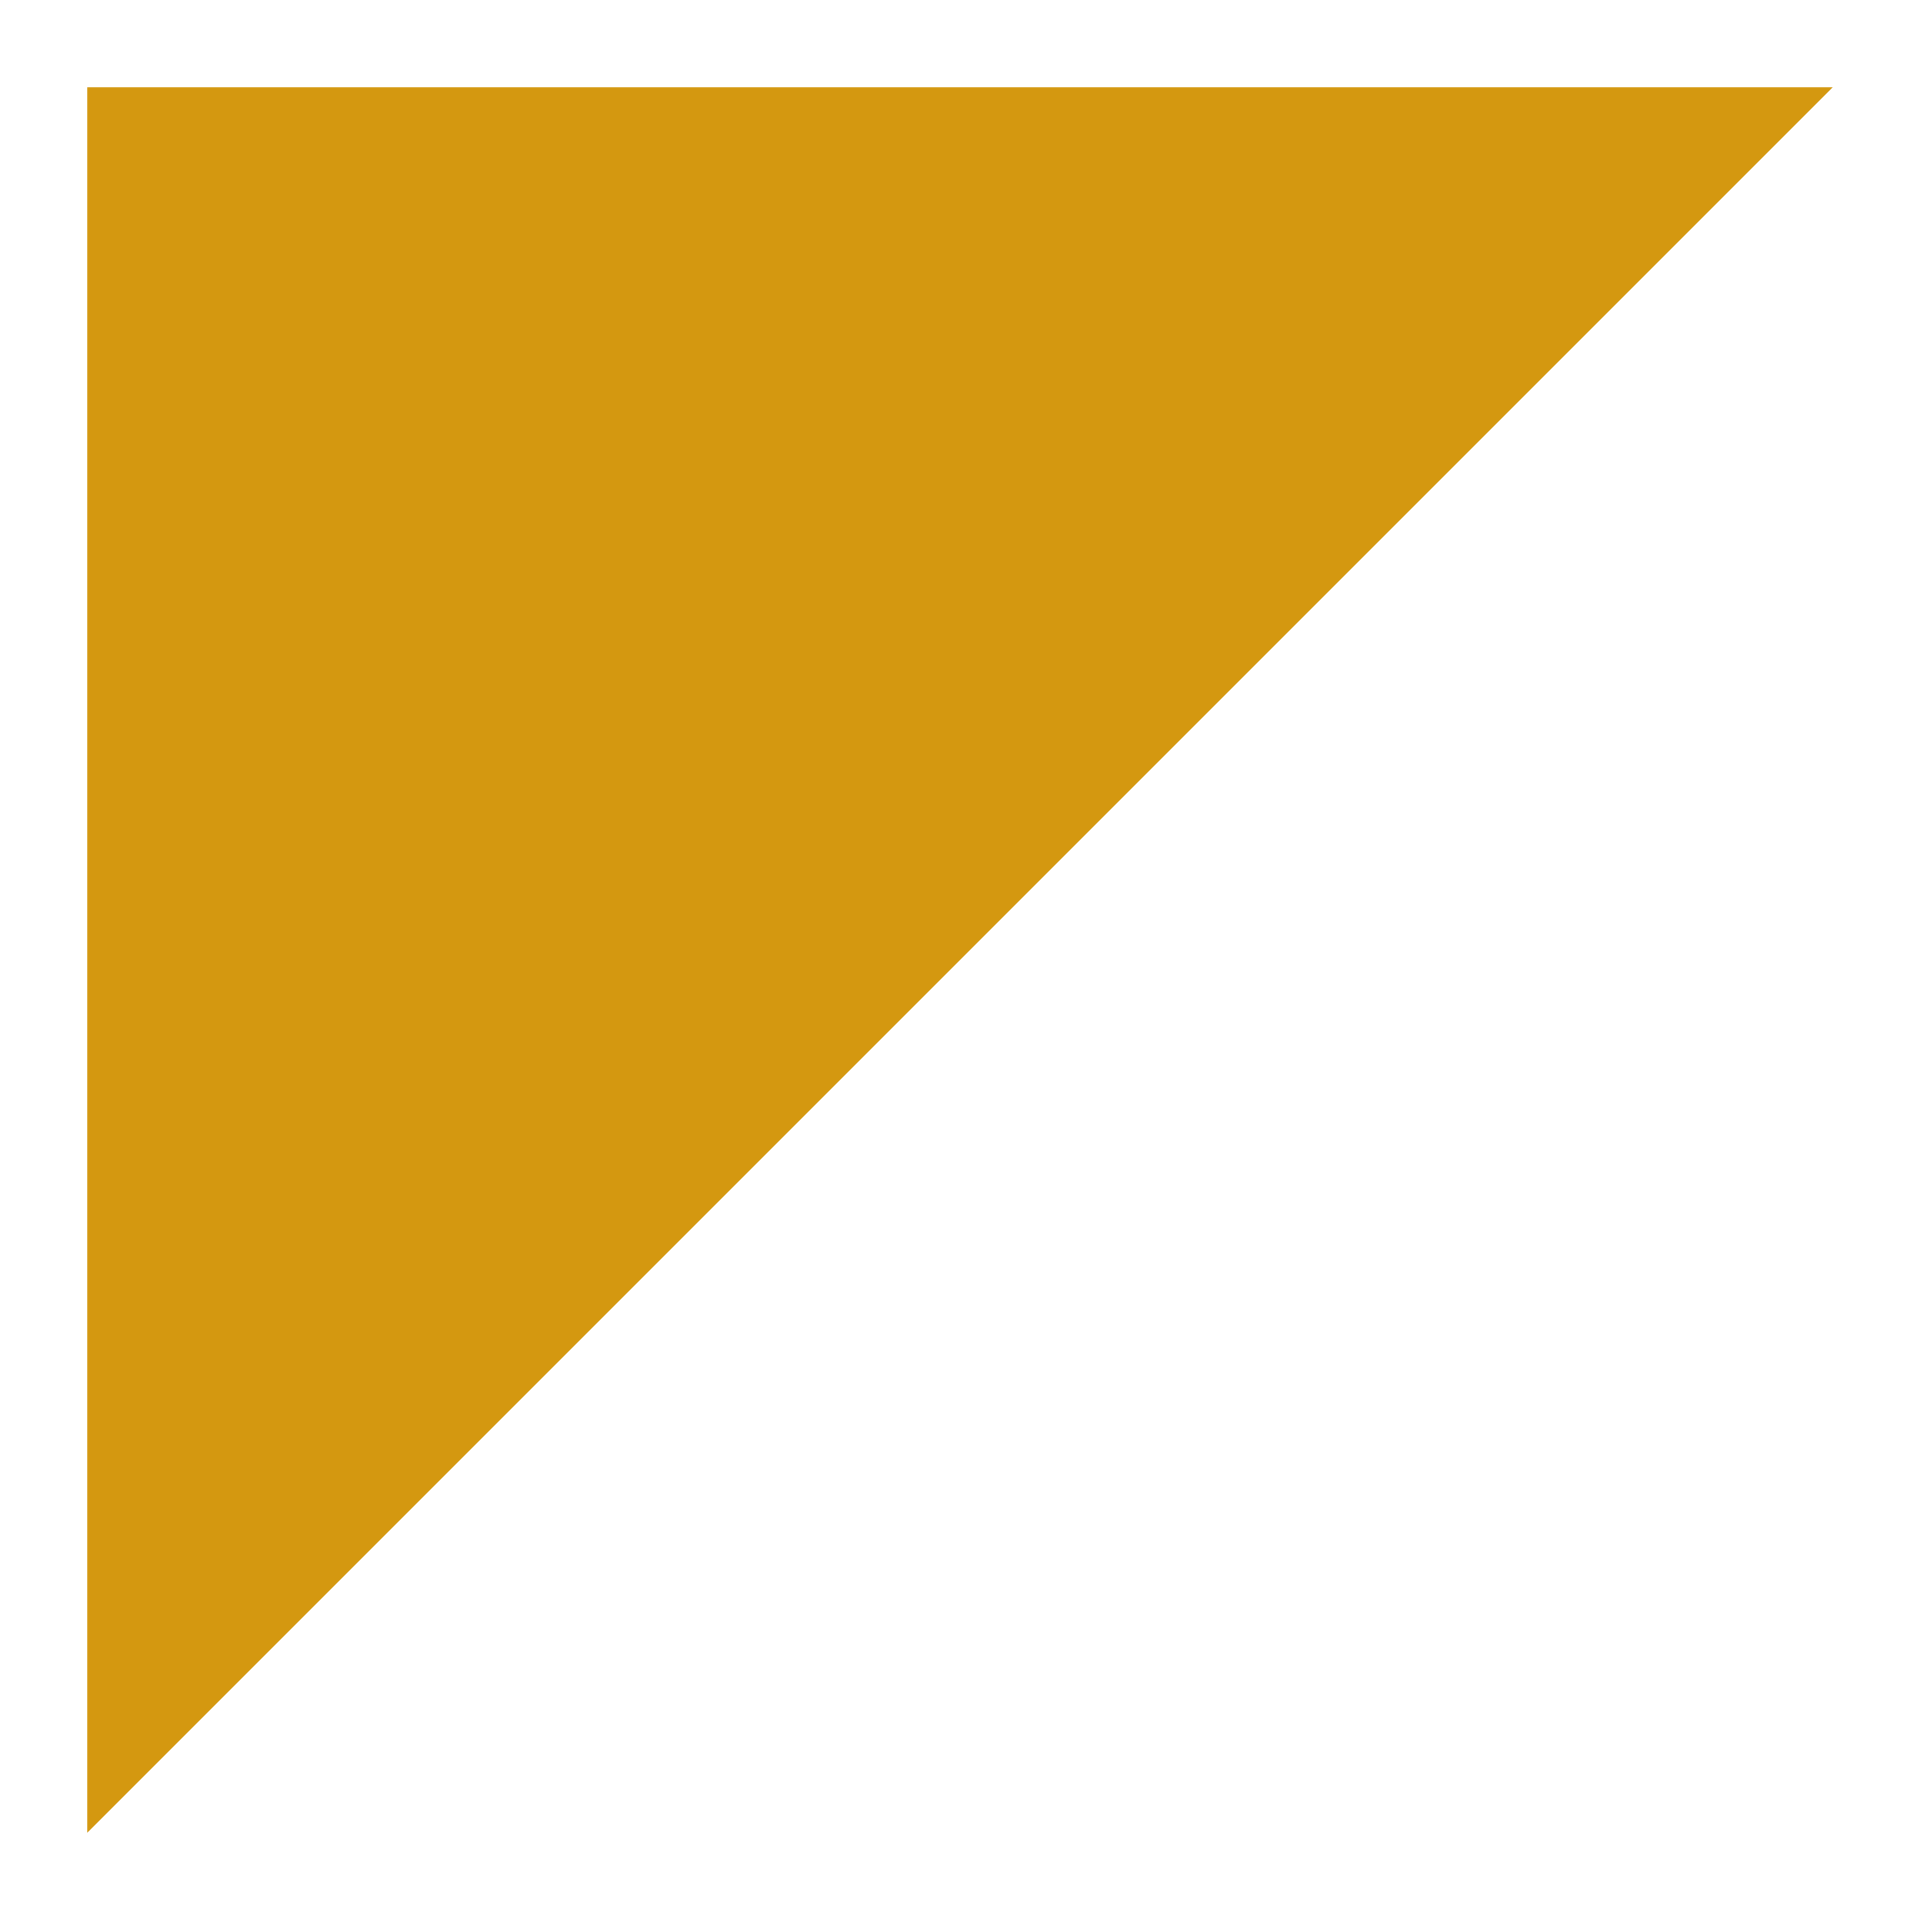
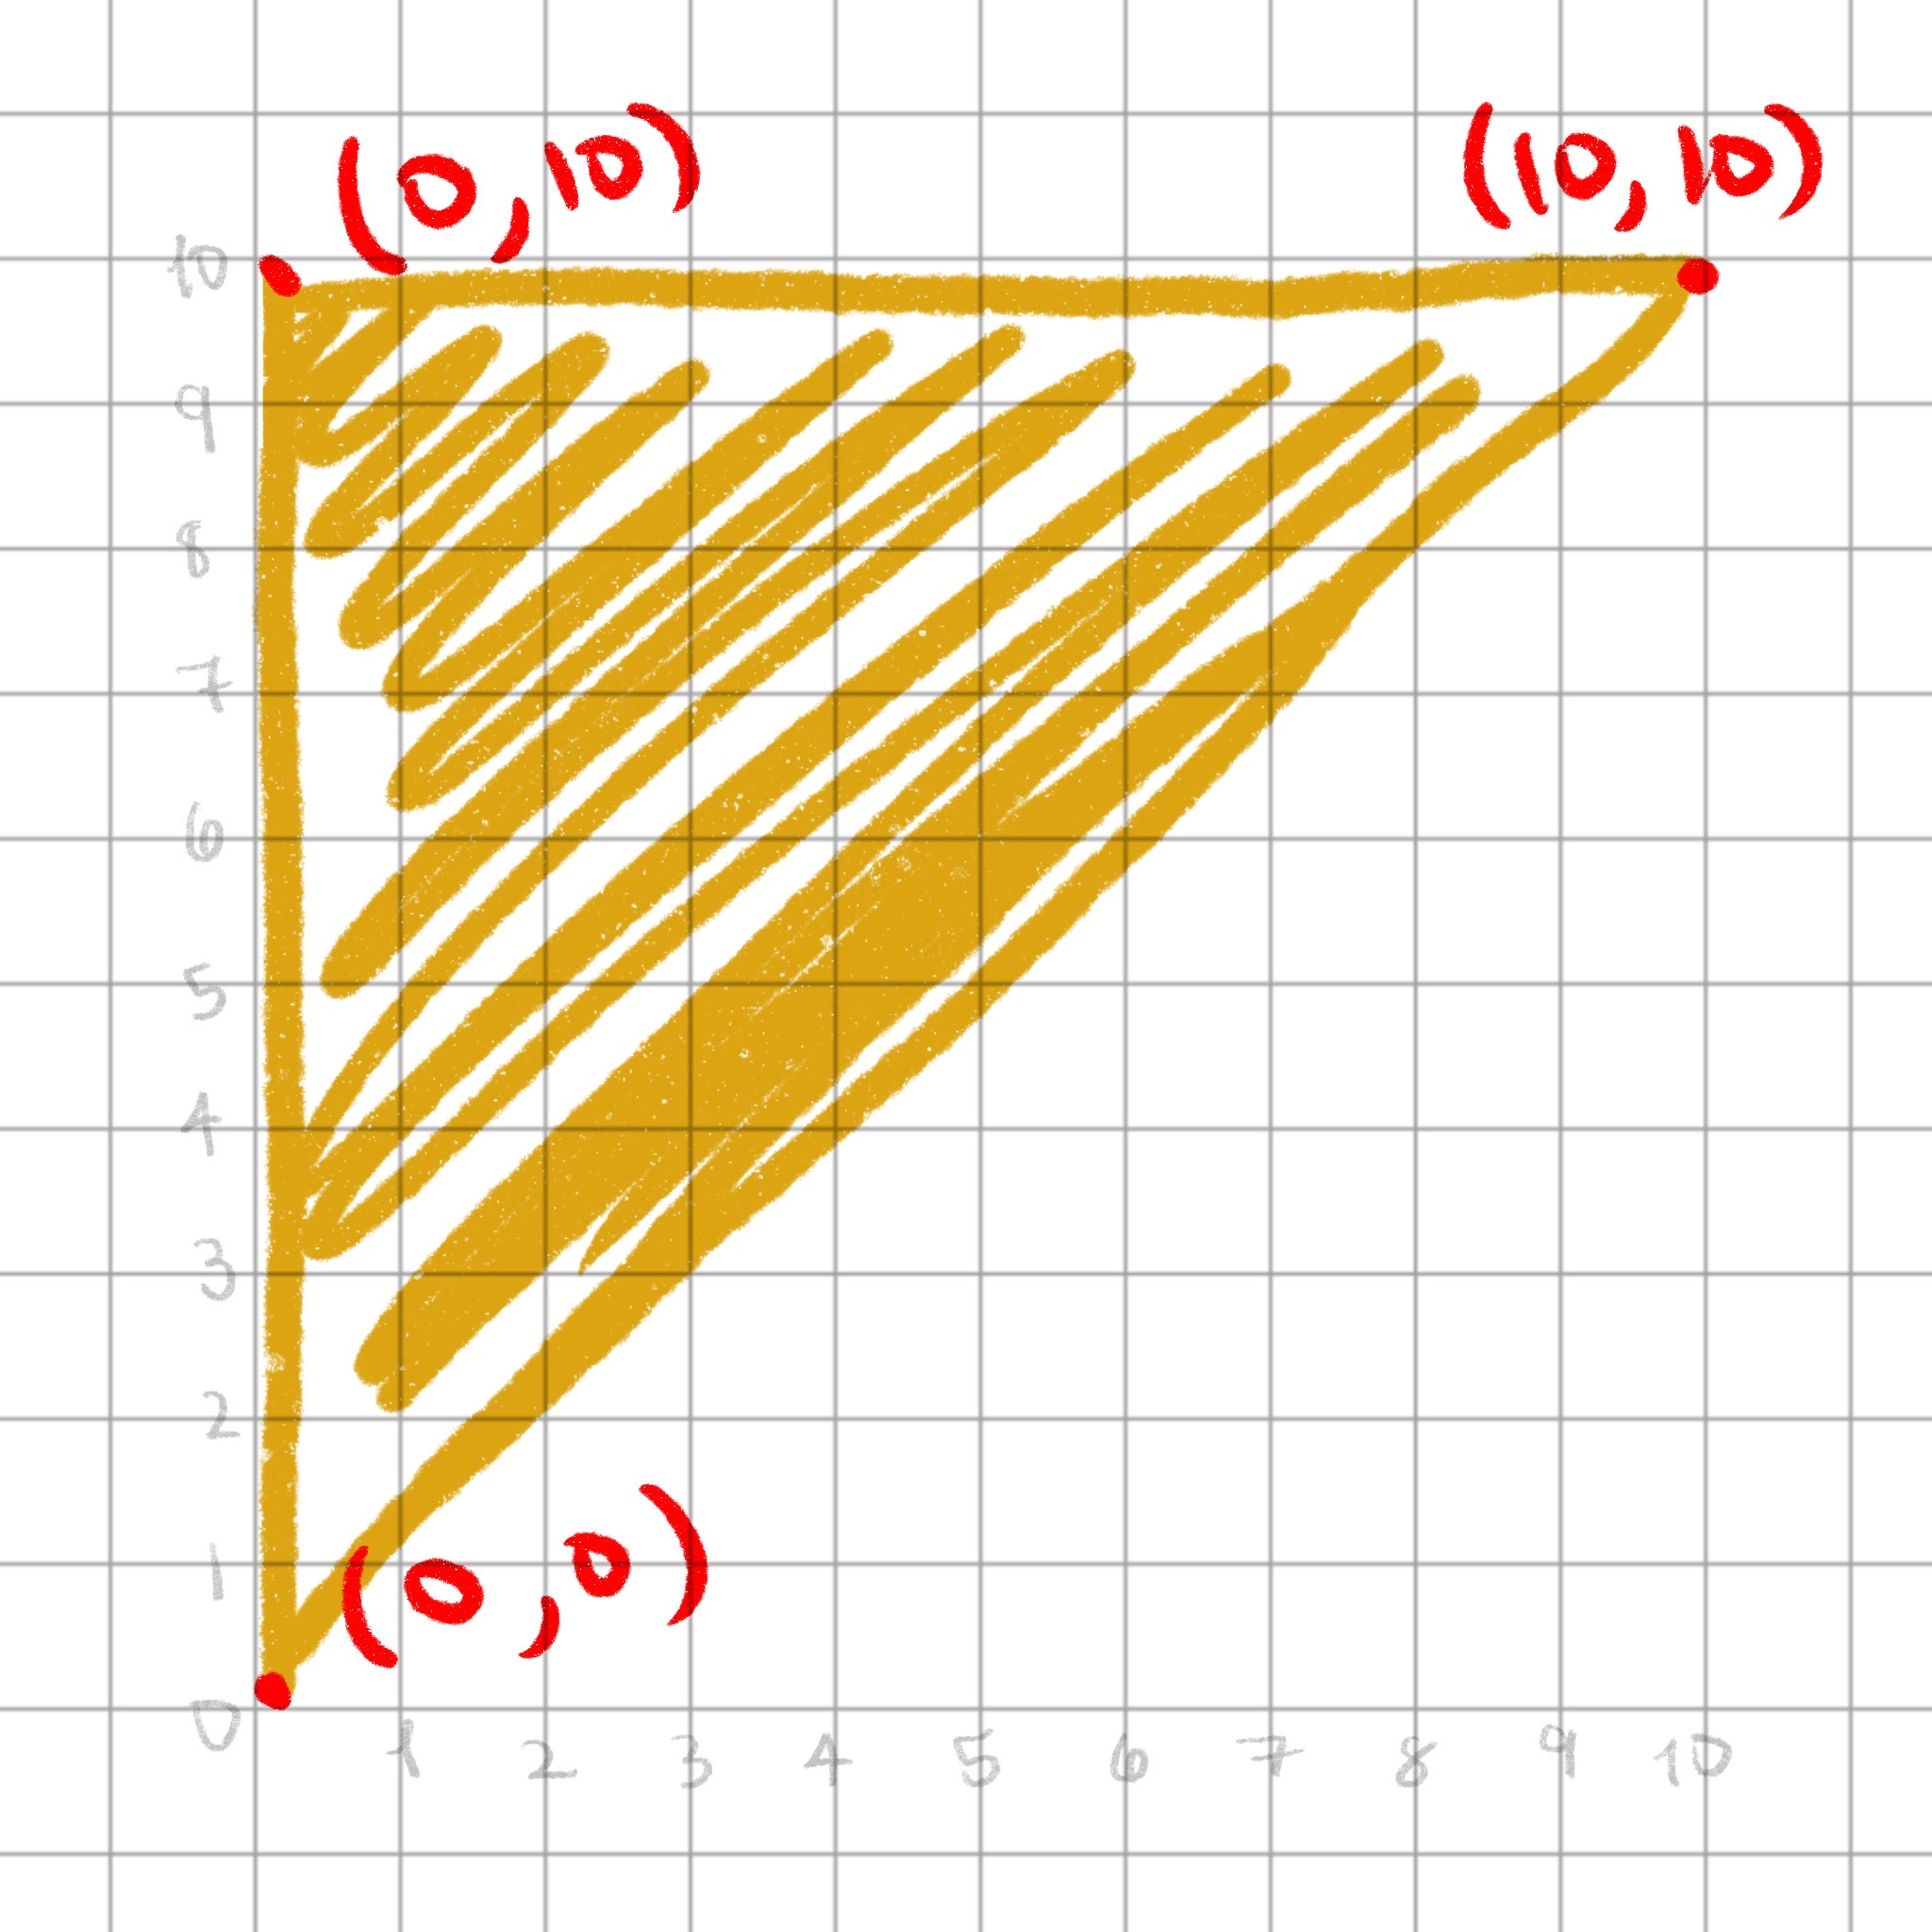
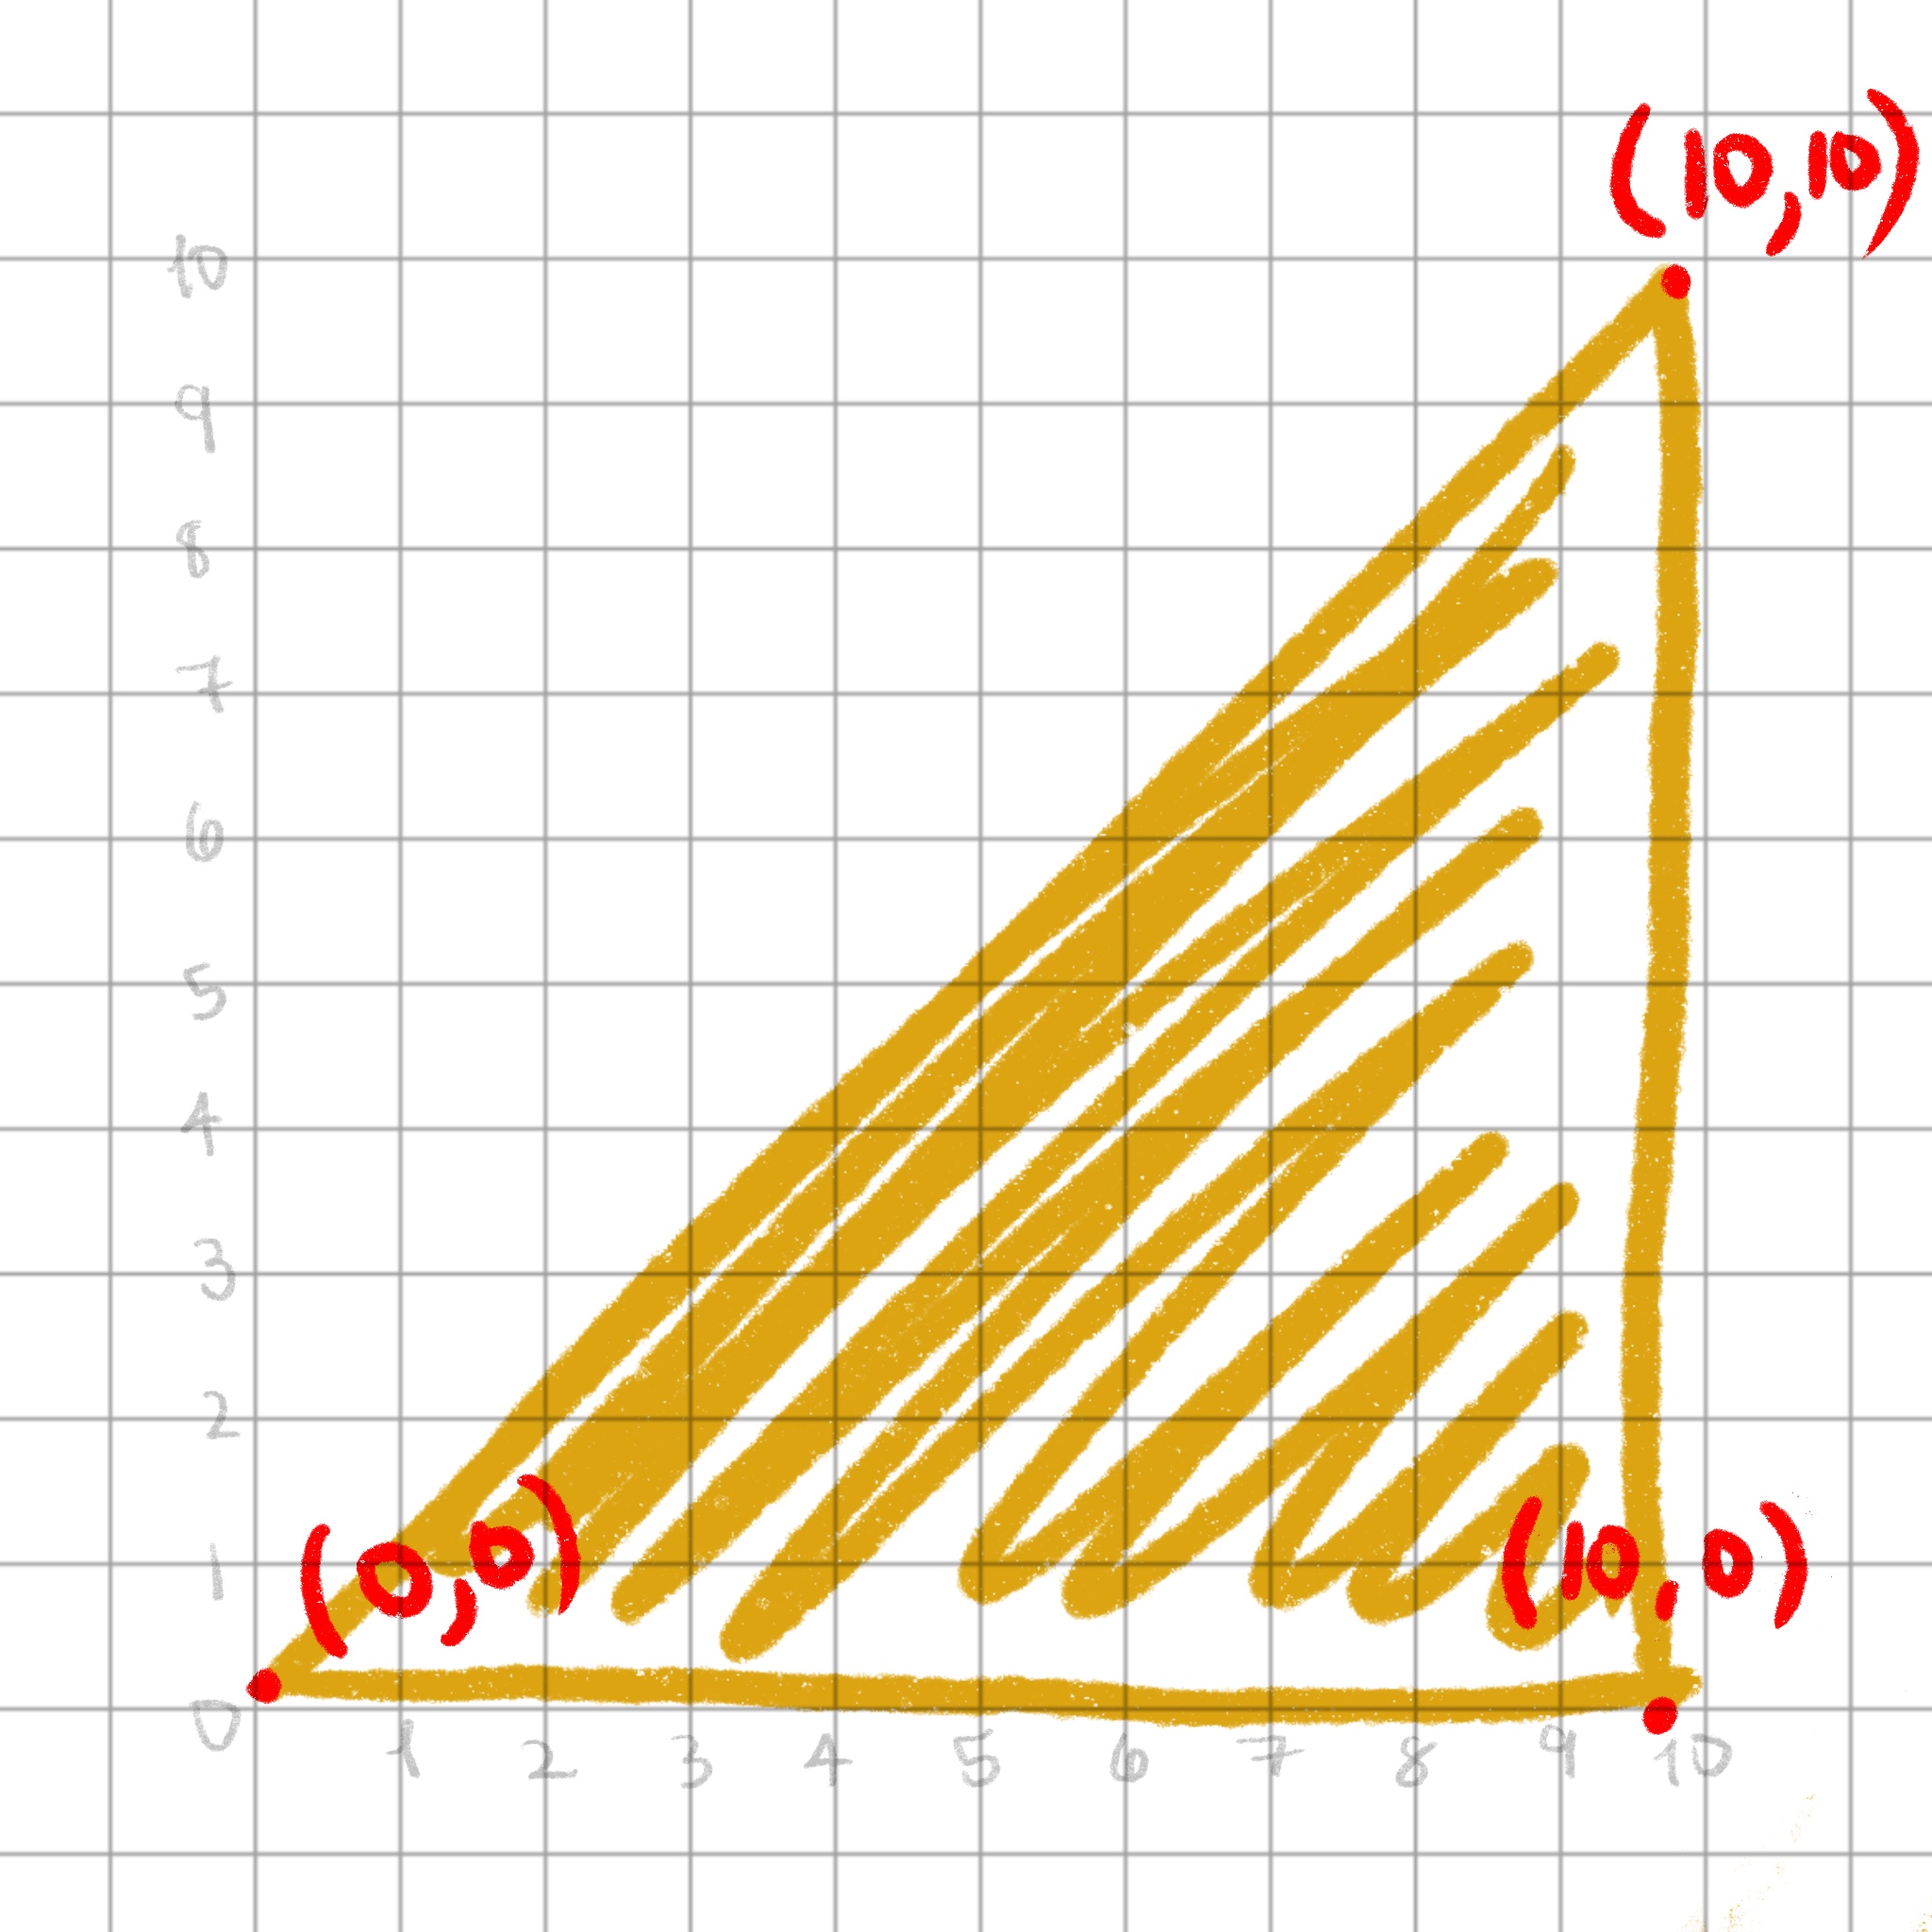
Upper triangle
Upper triangle
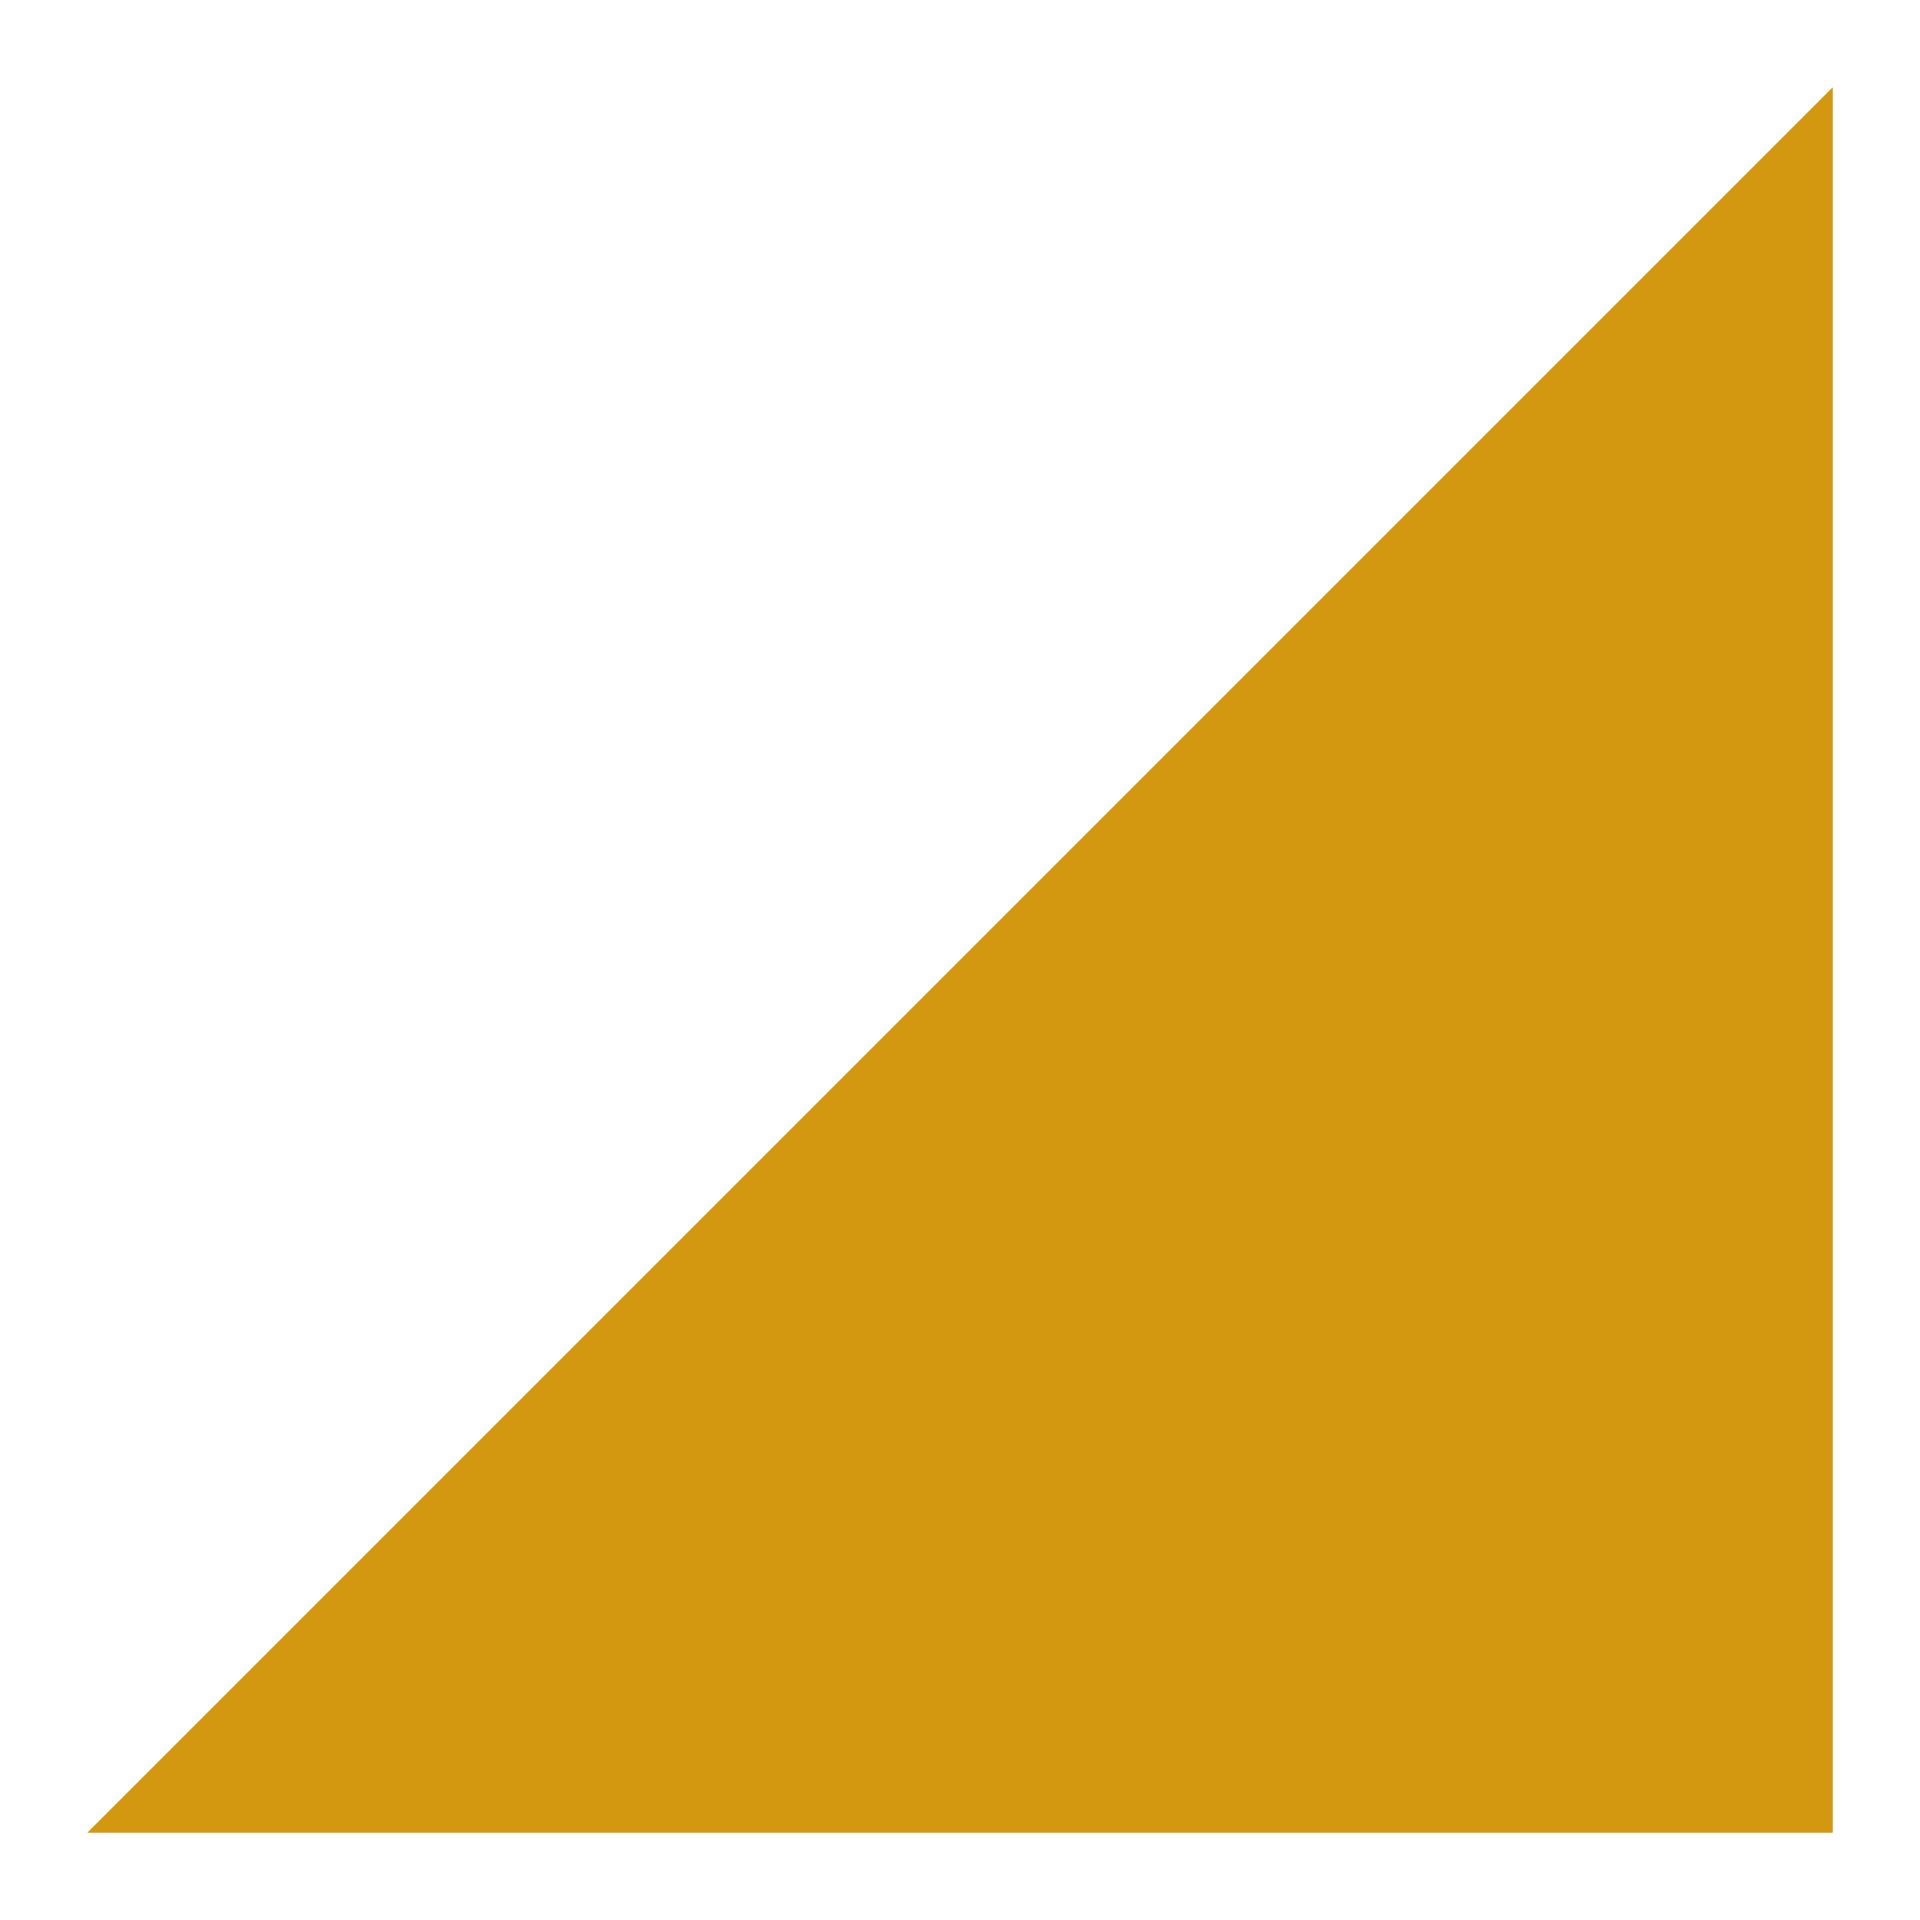
Lower triangle
Lower triangle
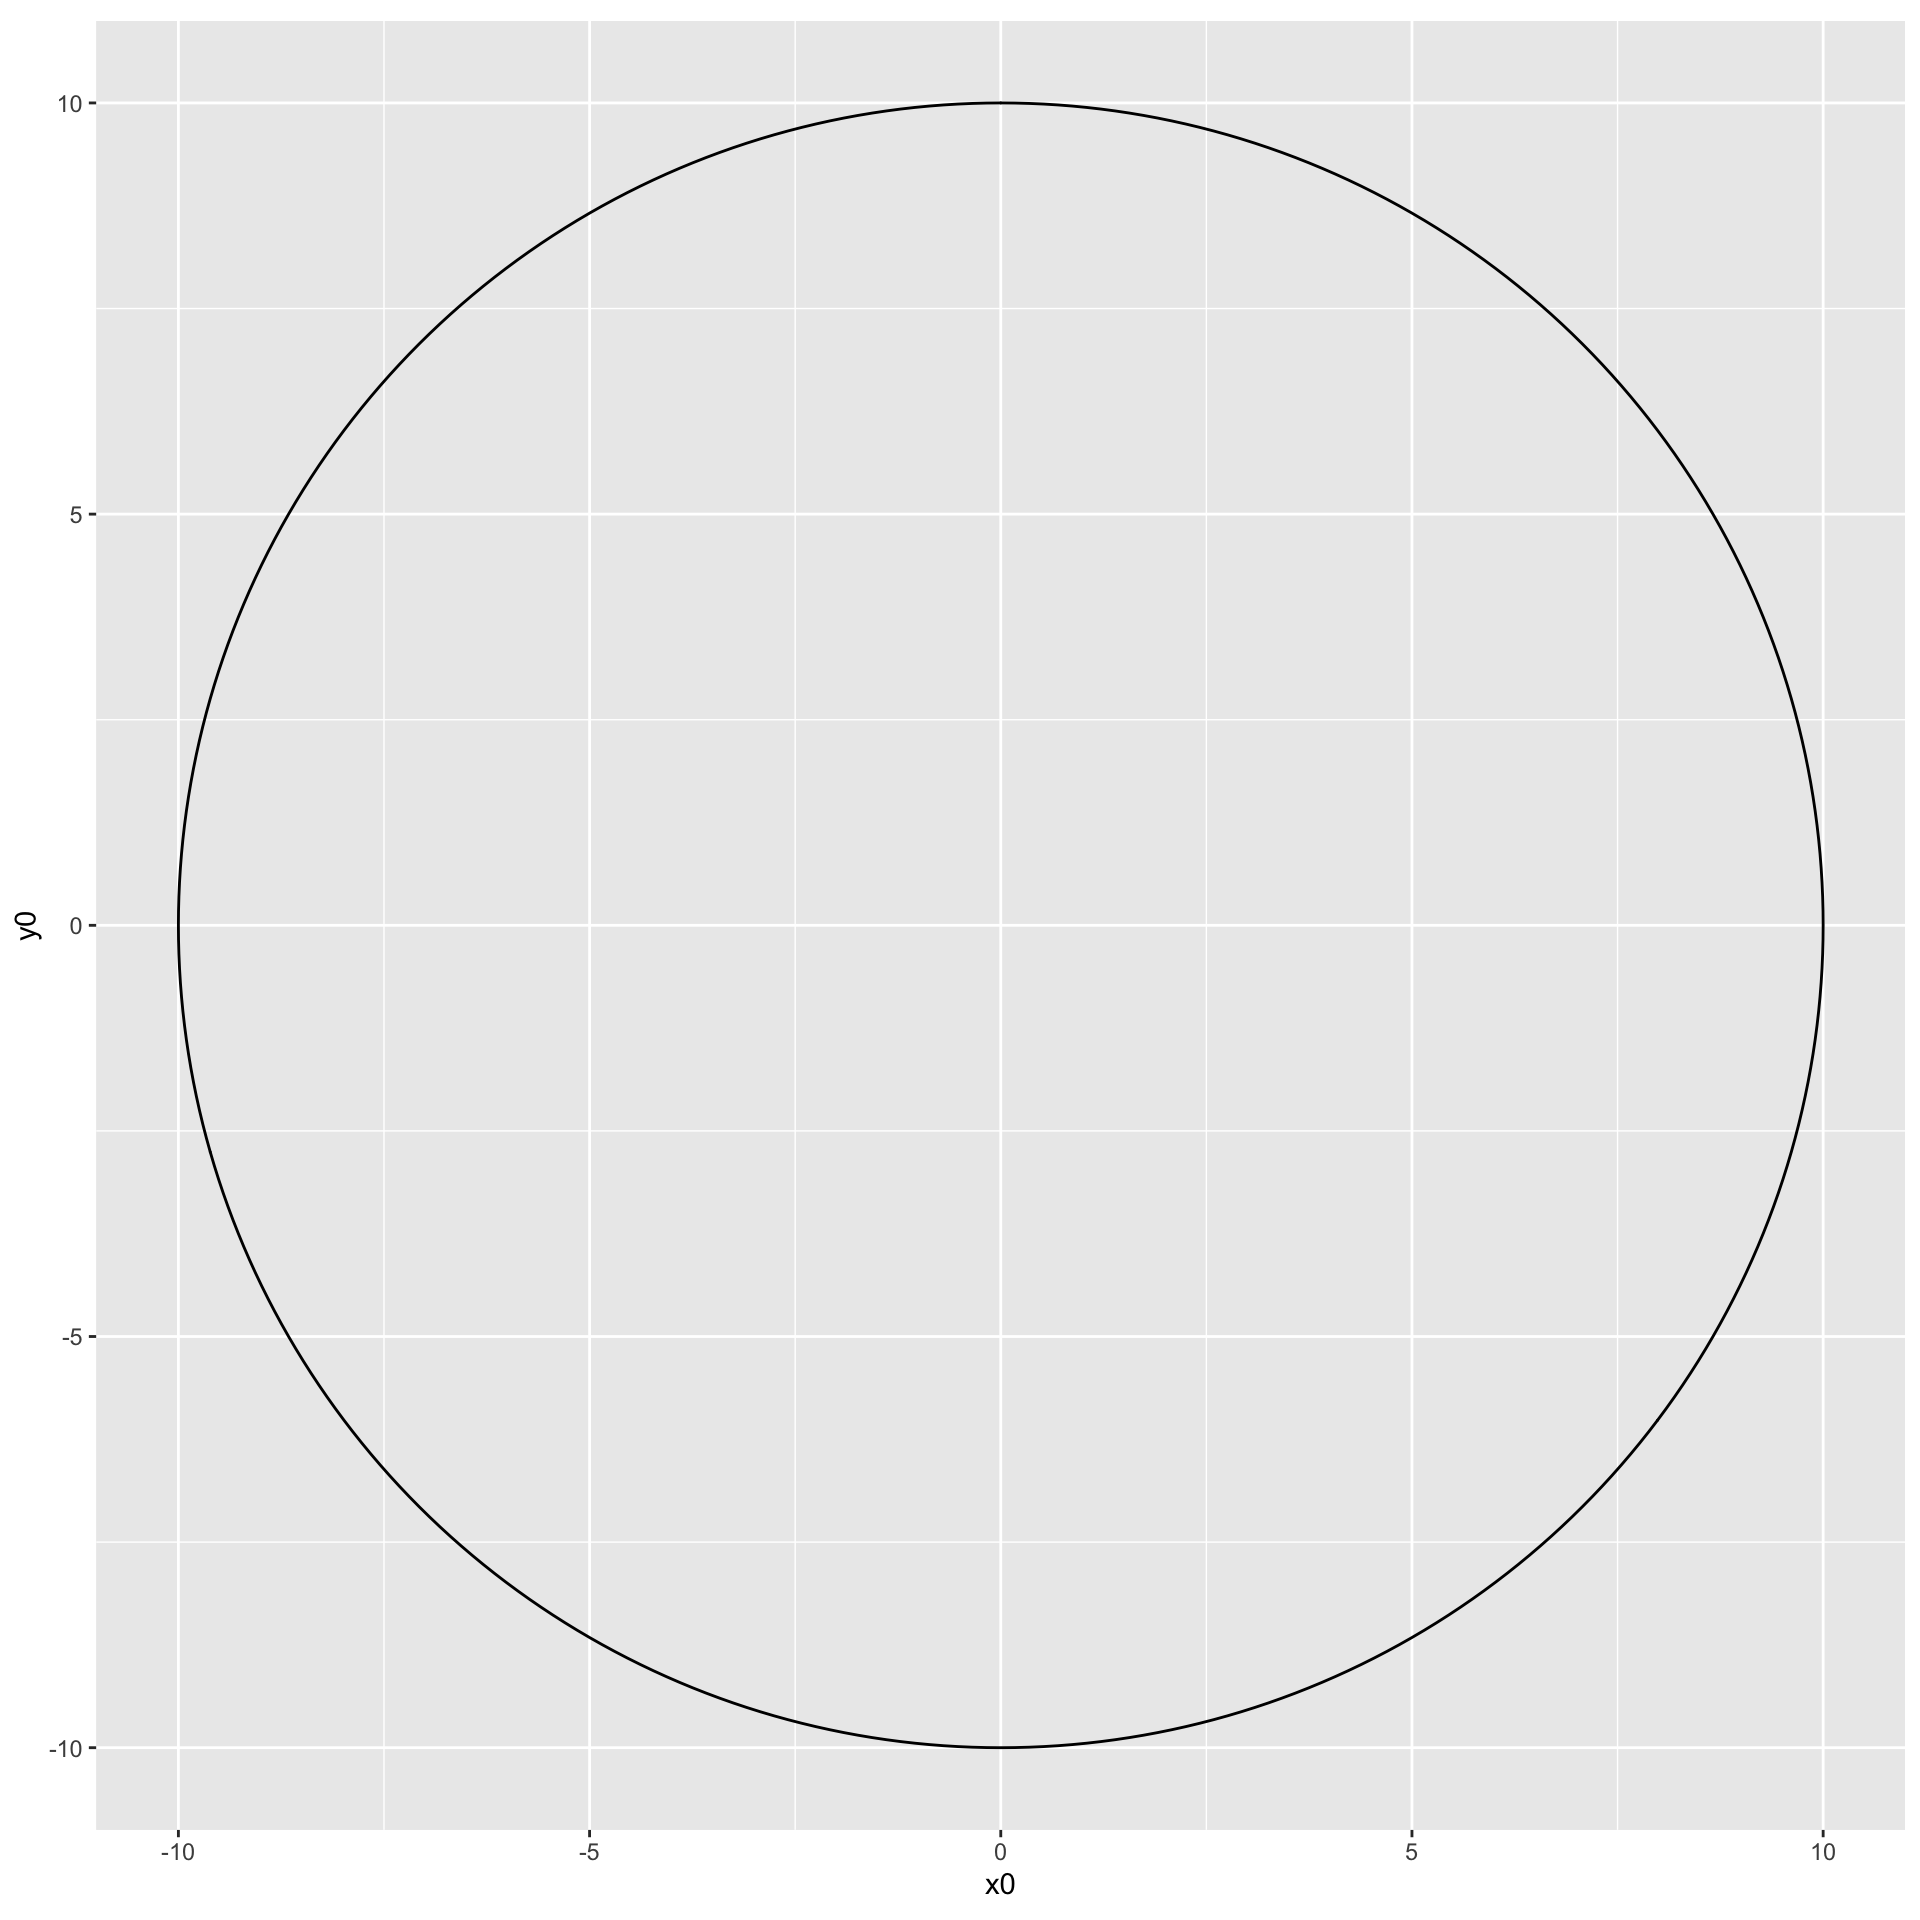
Making circles
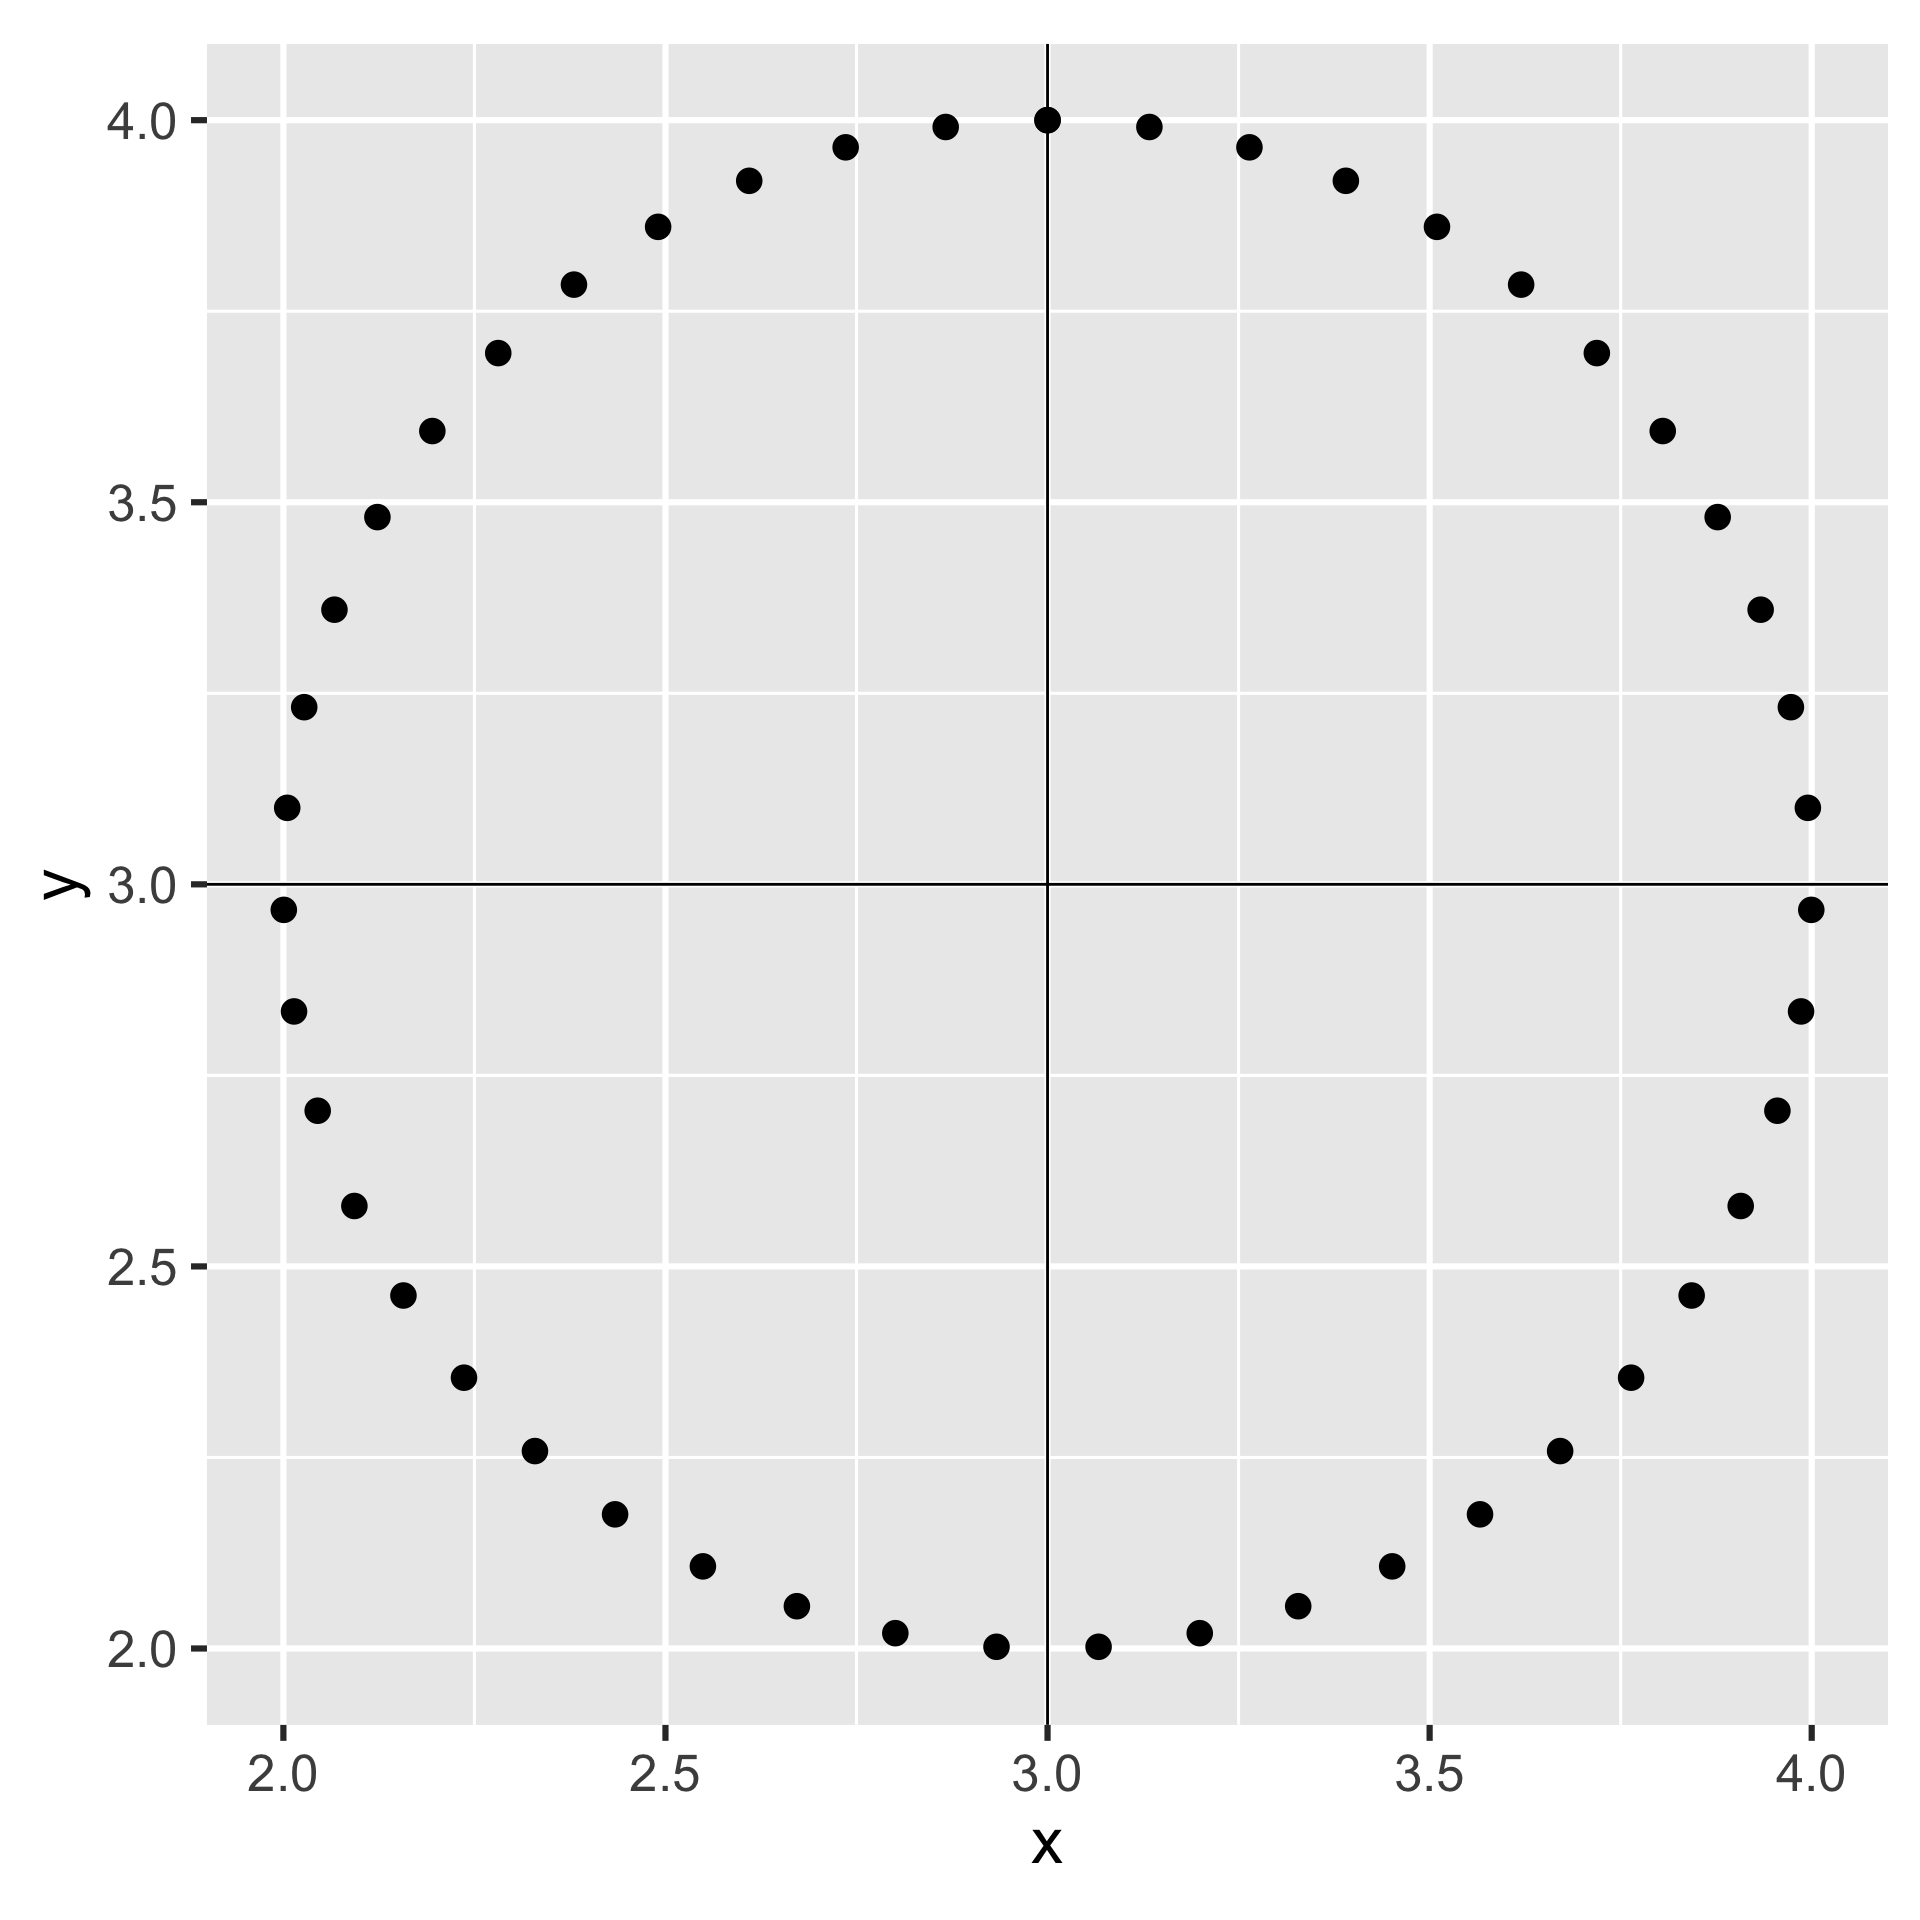
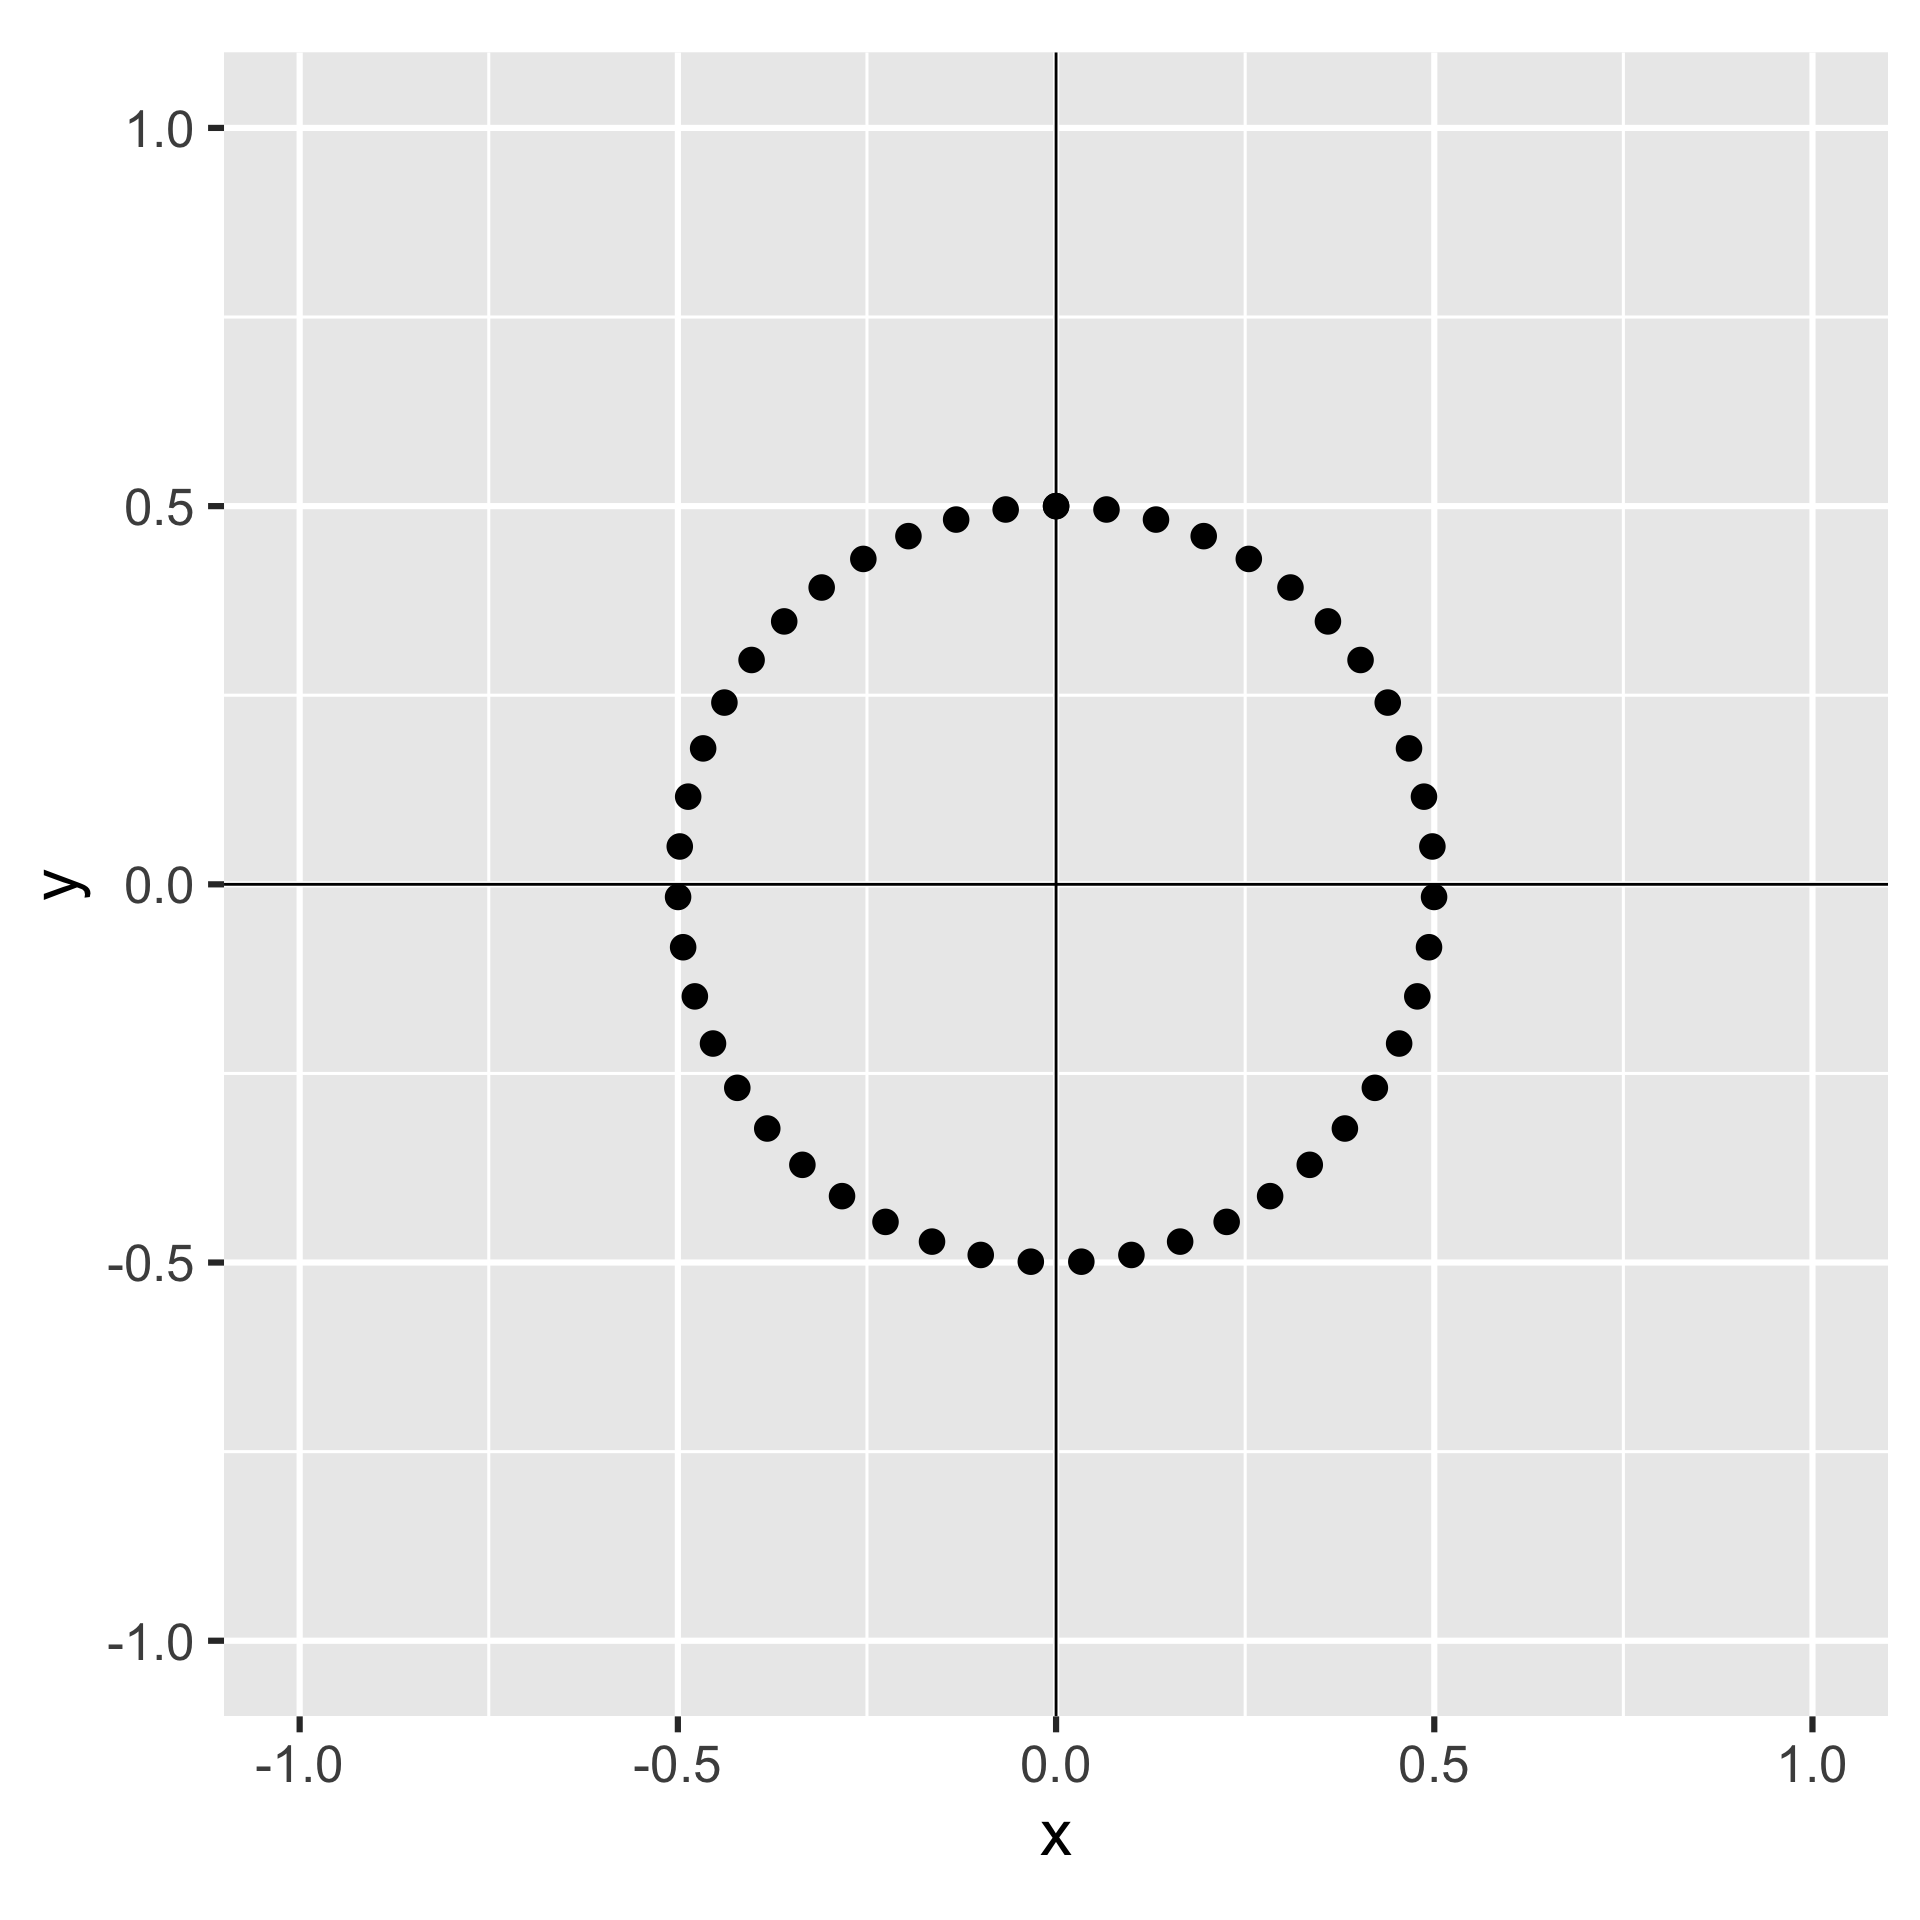
geom_circle() from {ggforce} draws a circle based on the center point (x0, y0) and the radius (r)
Making parts of circles
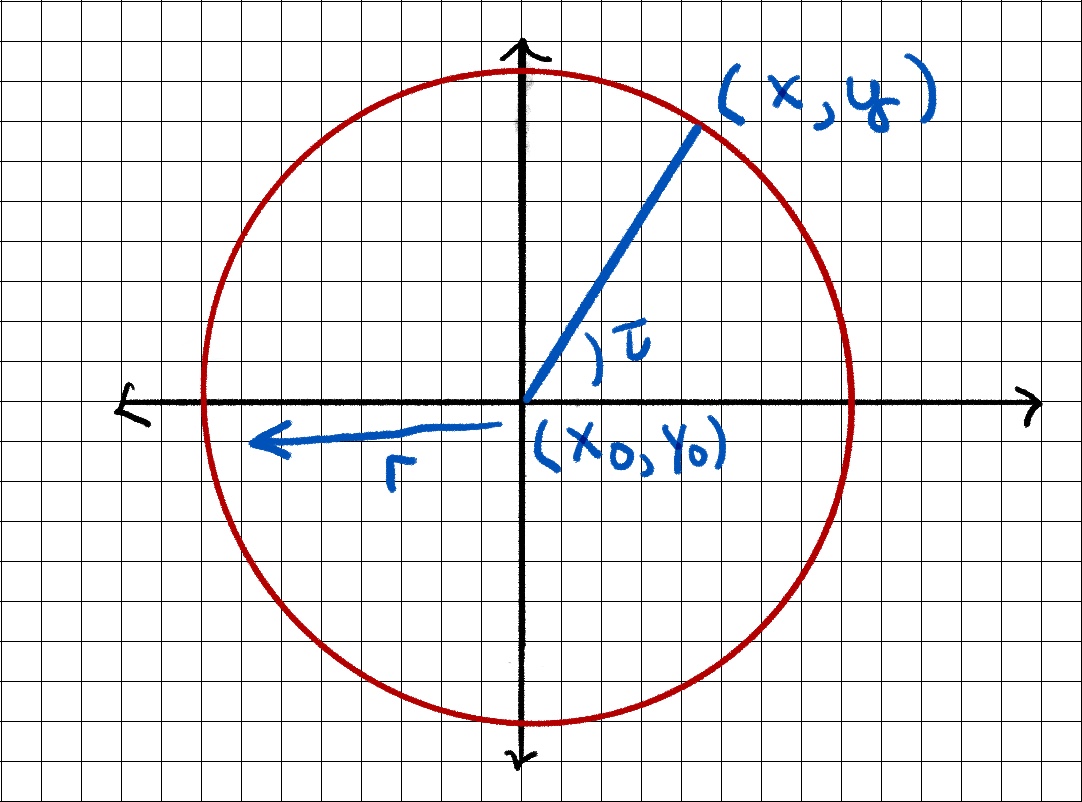
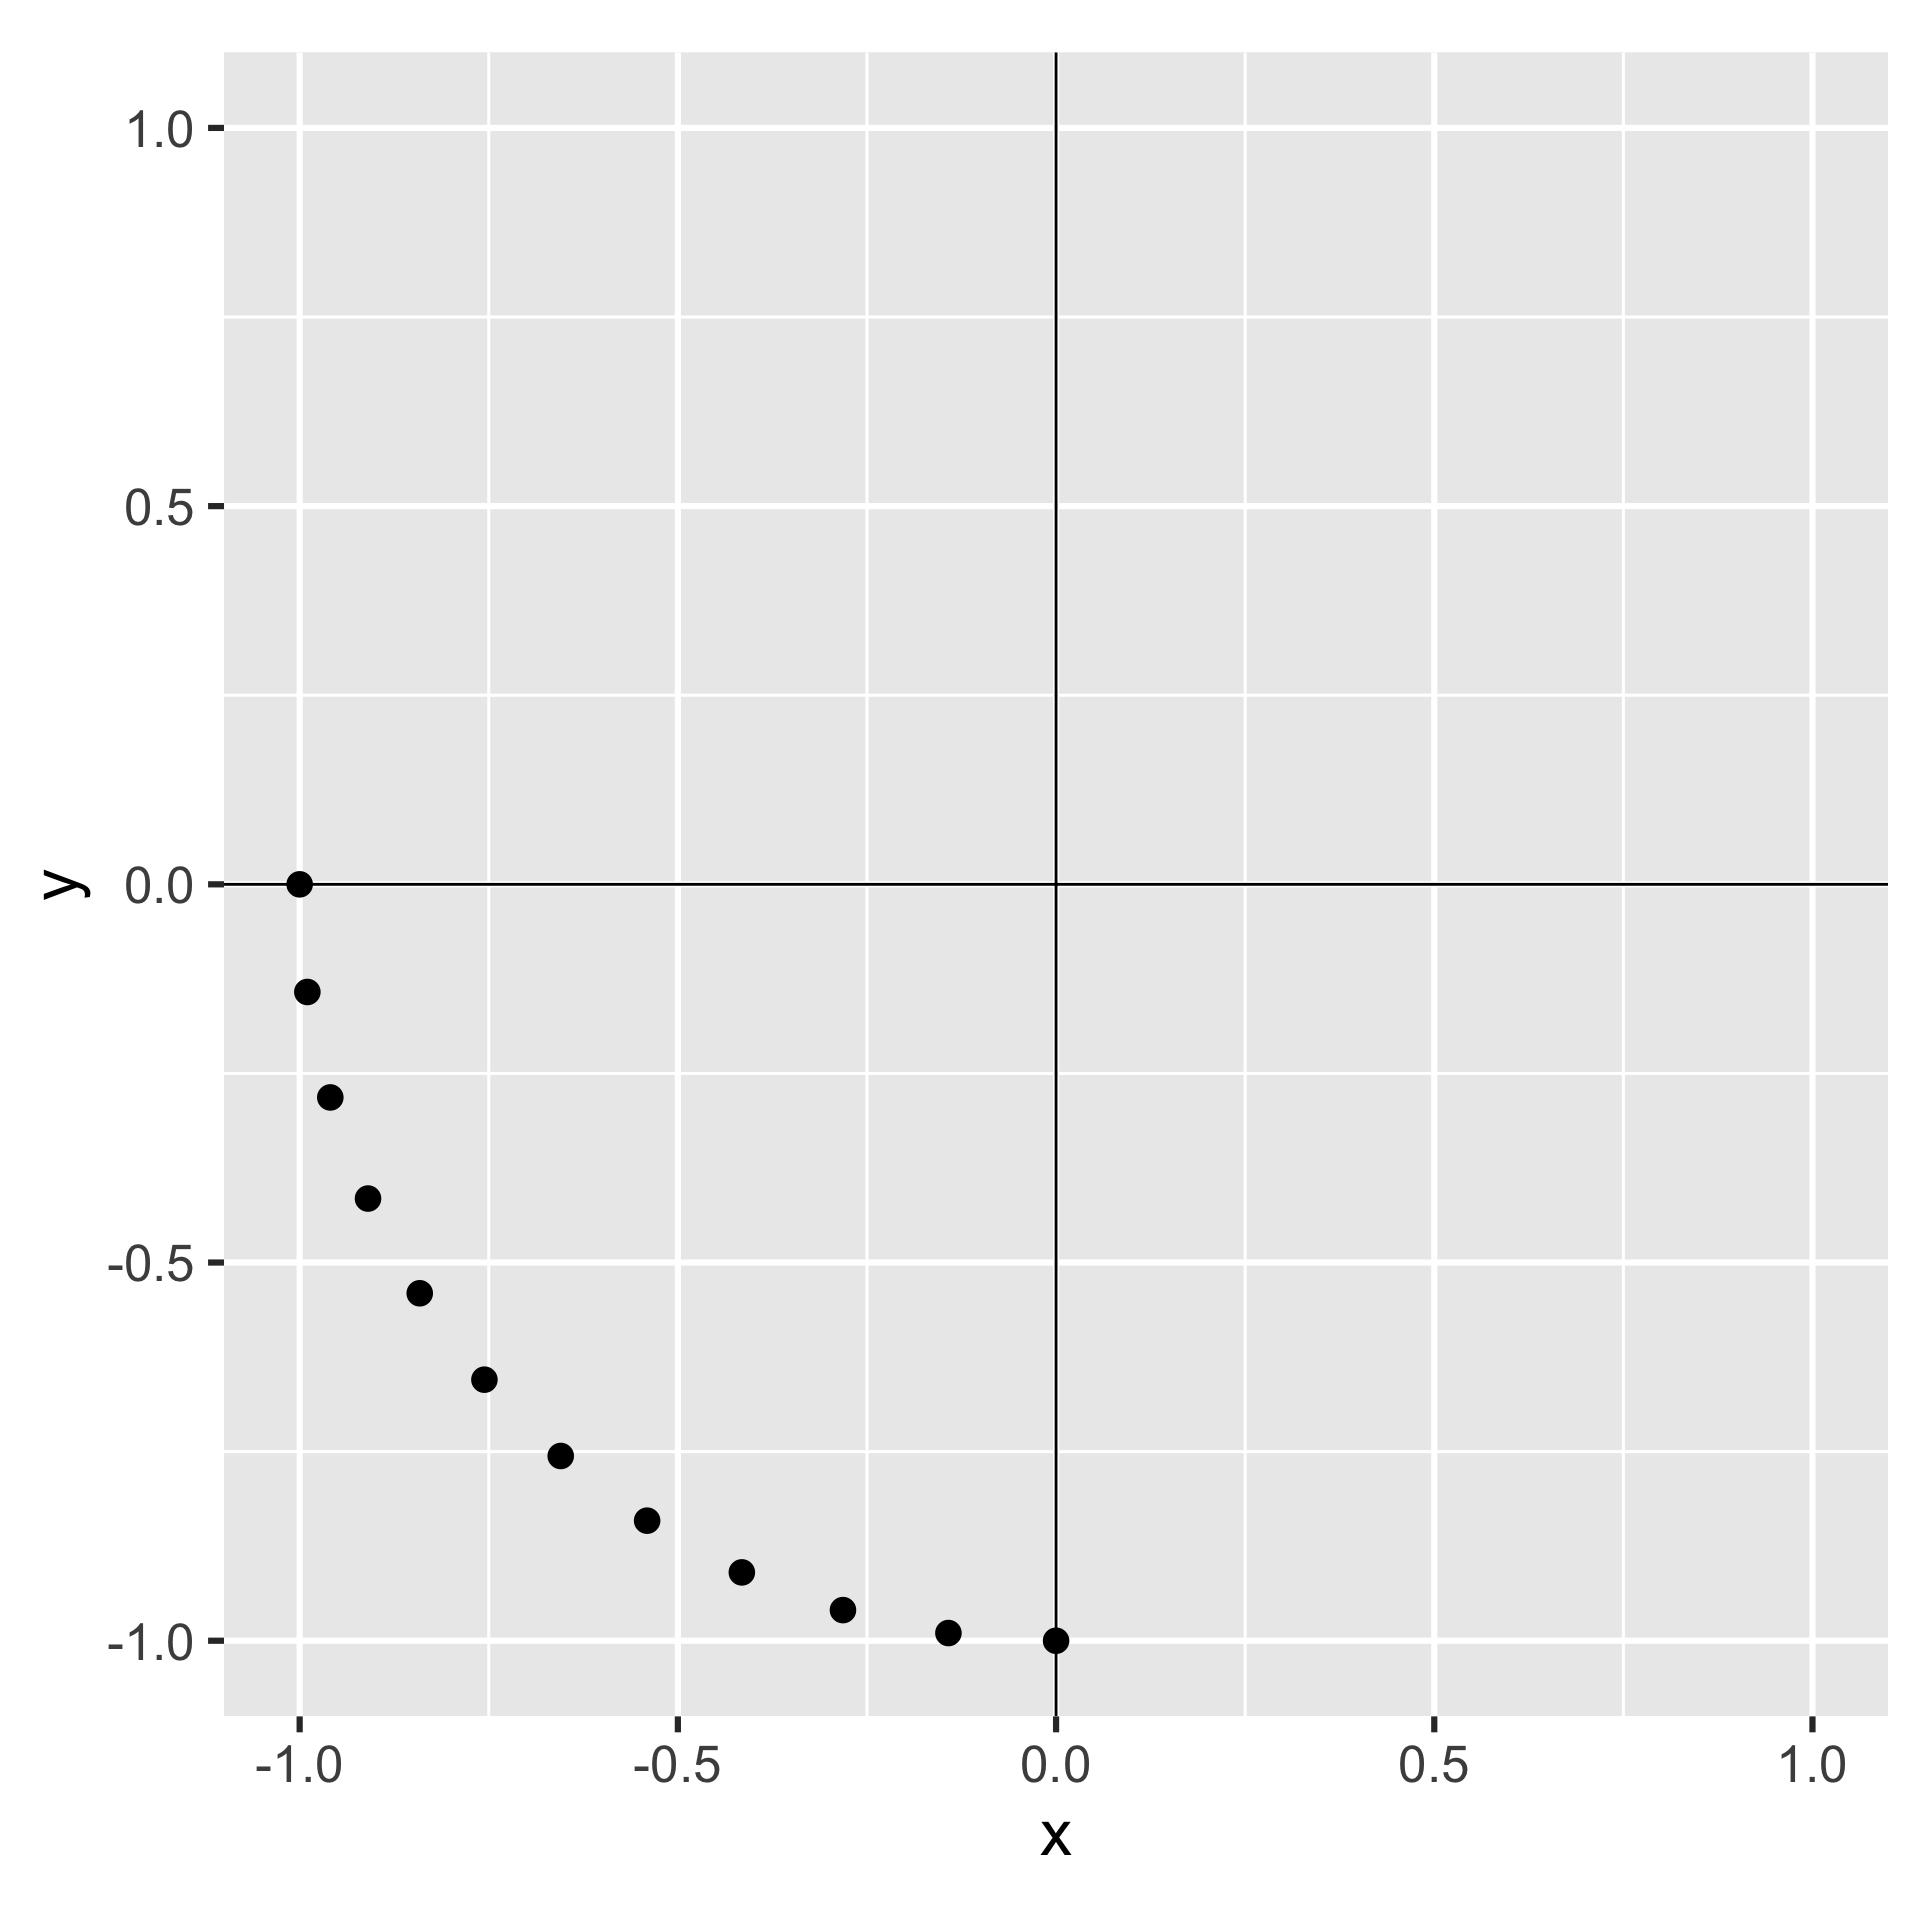
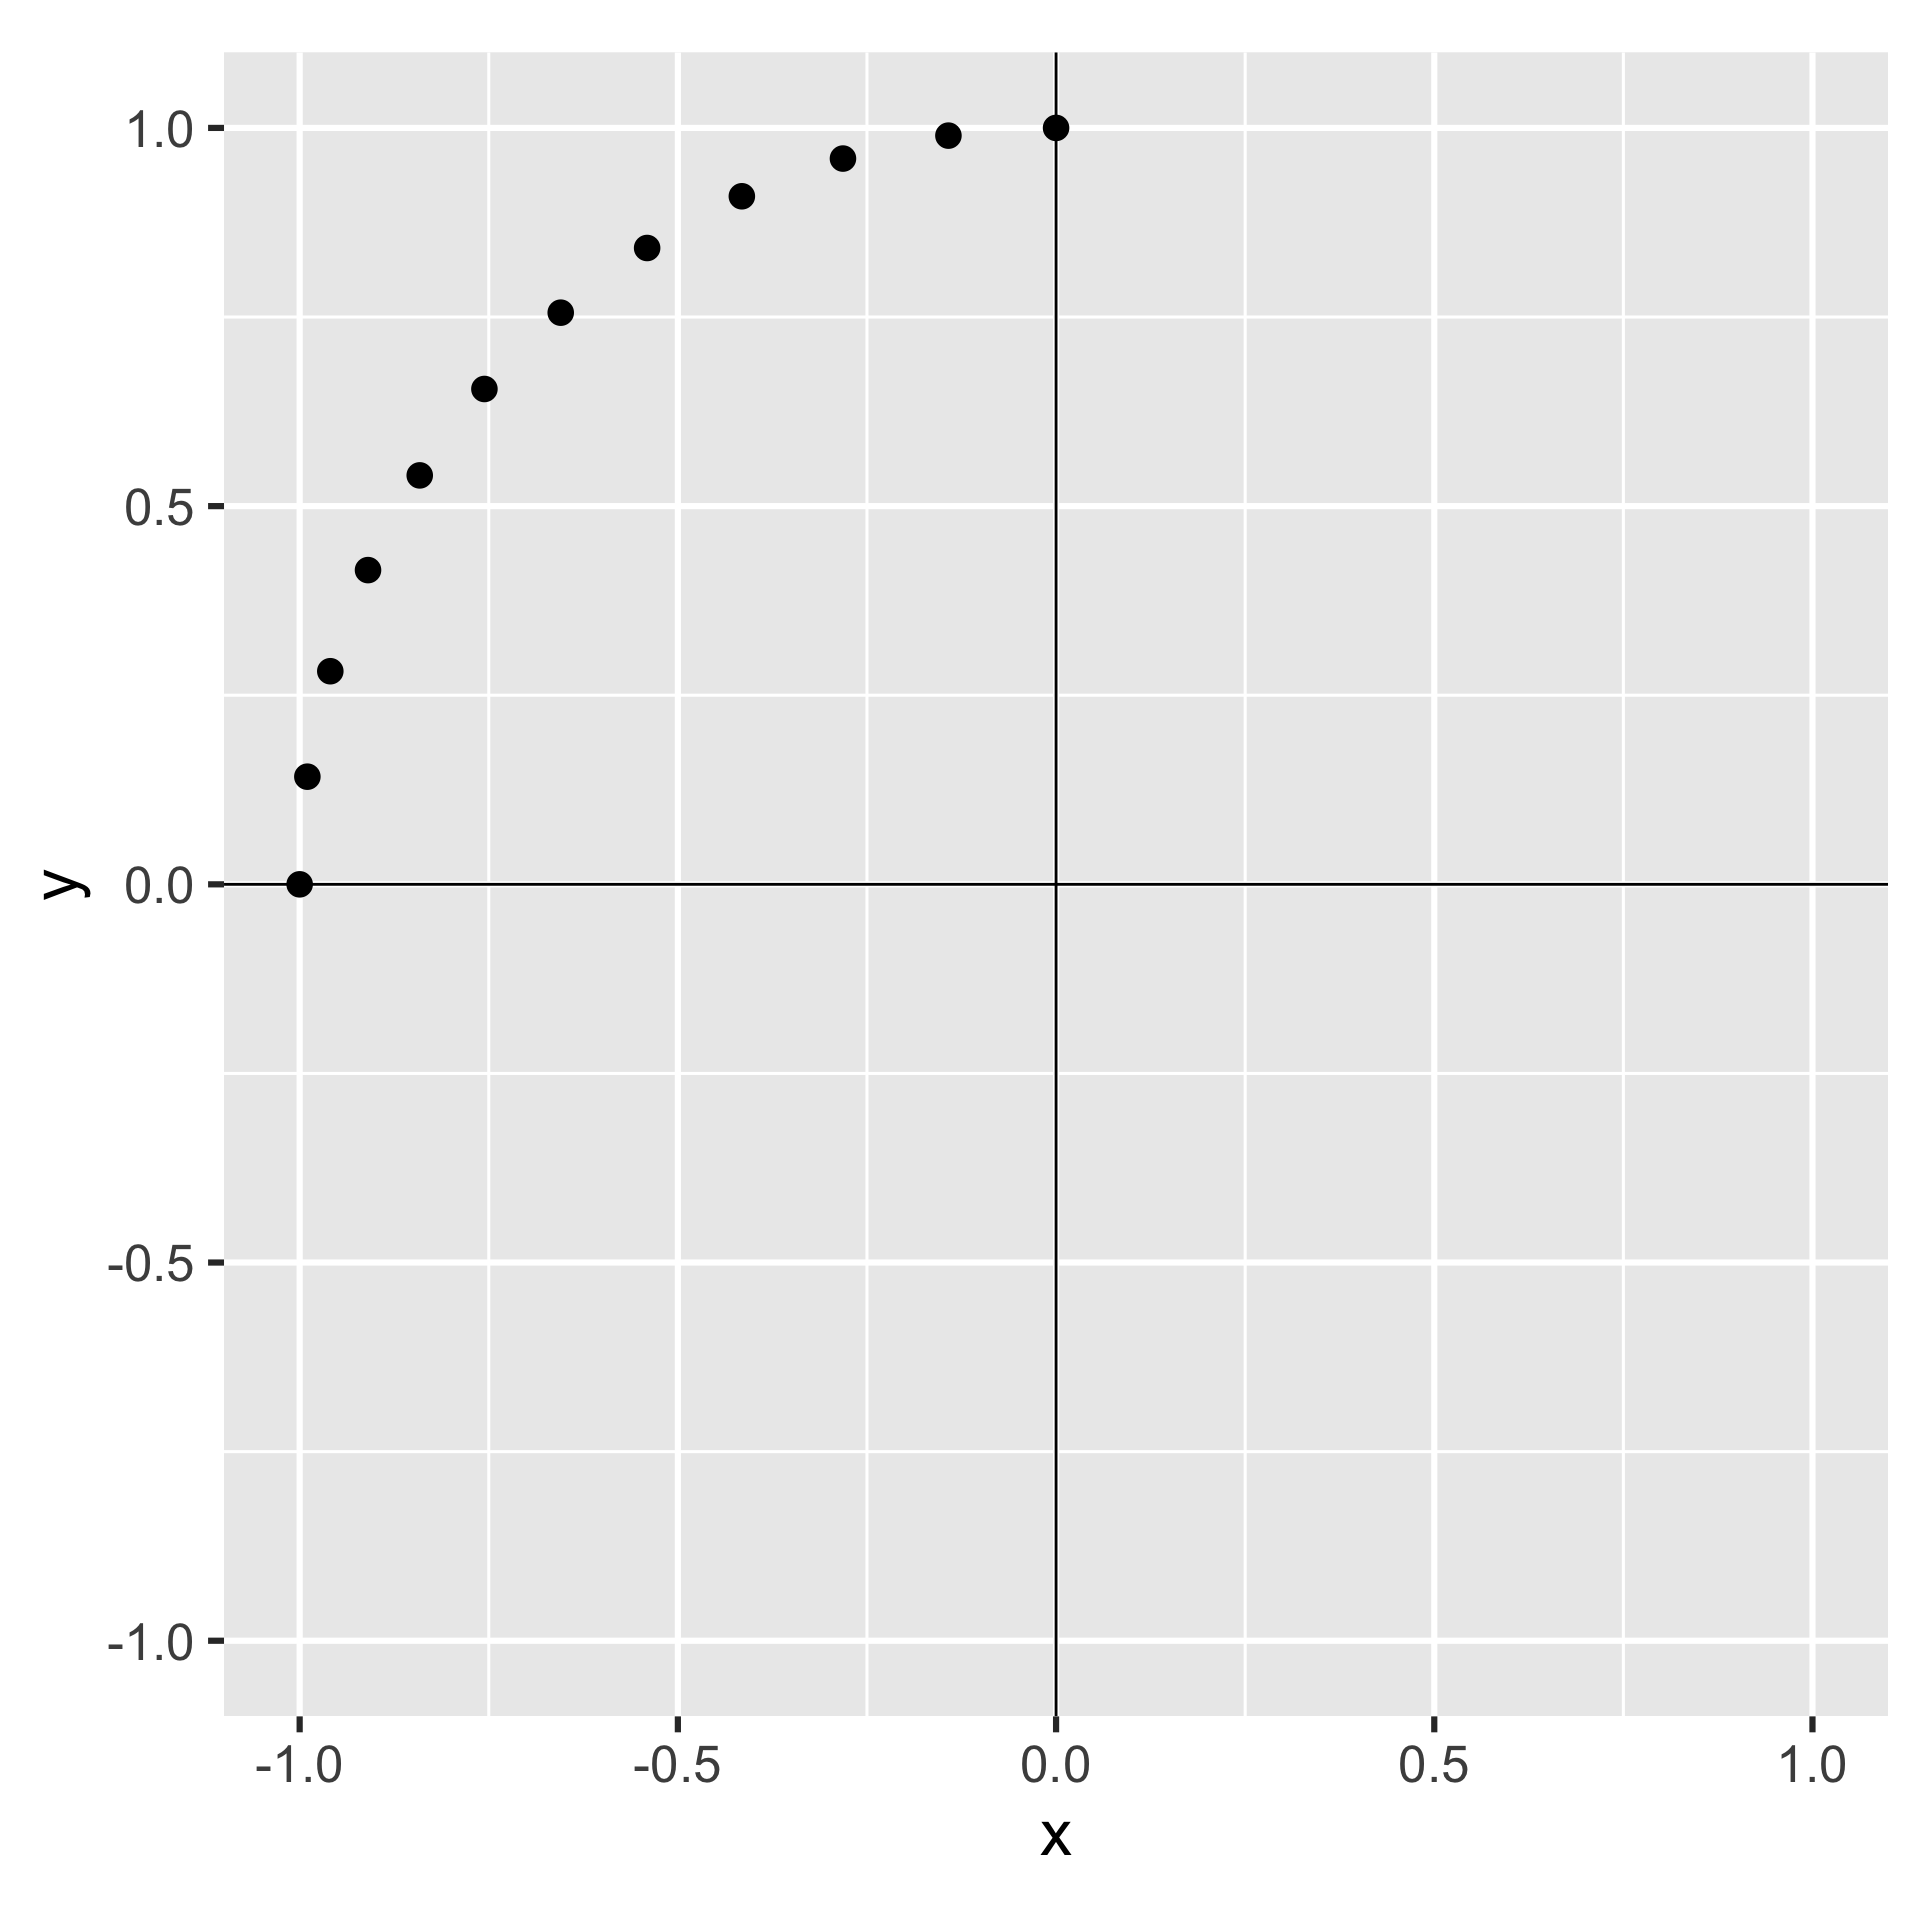
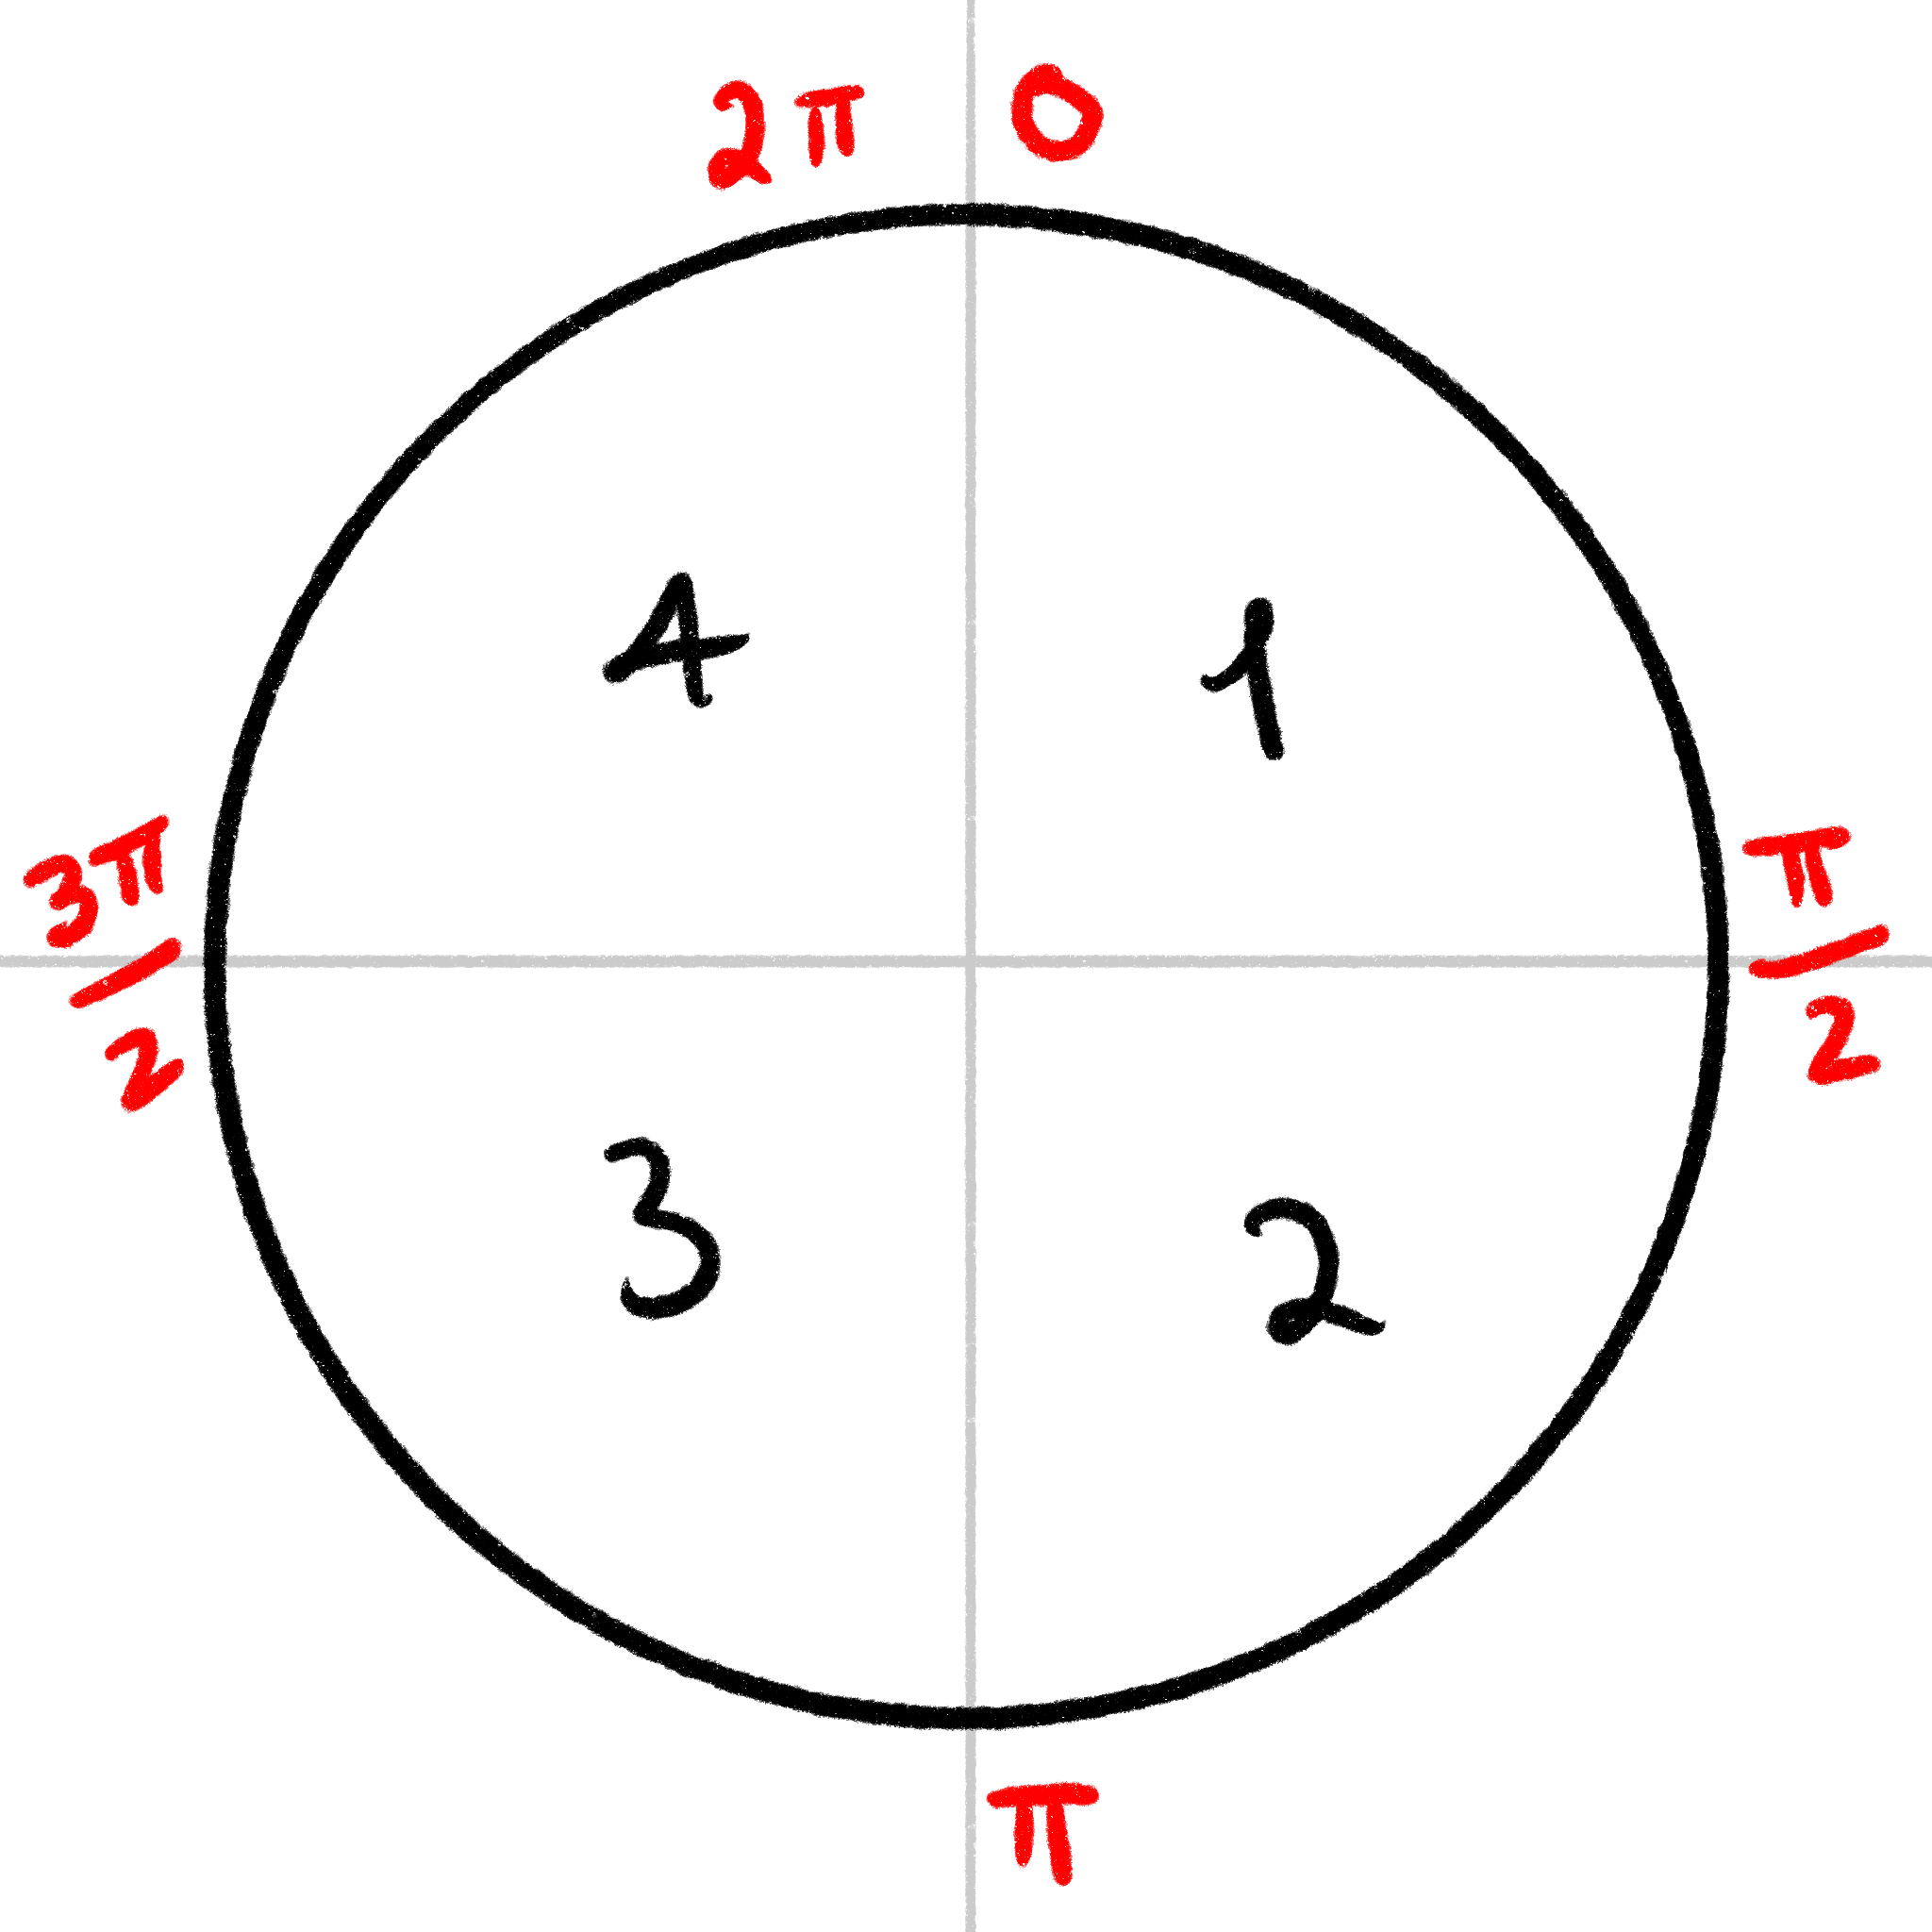
Another brief math interlude…
~the parametric equation~
For a circle:
- centered at
x0,y0 - with a radius of
r
The coordinates a point at an angle tau from the center are:
x = x0 + sin(tau) * ry = y0 + cos(tau) * r
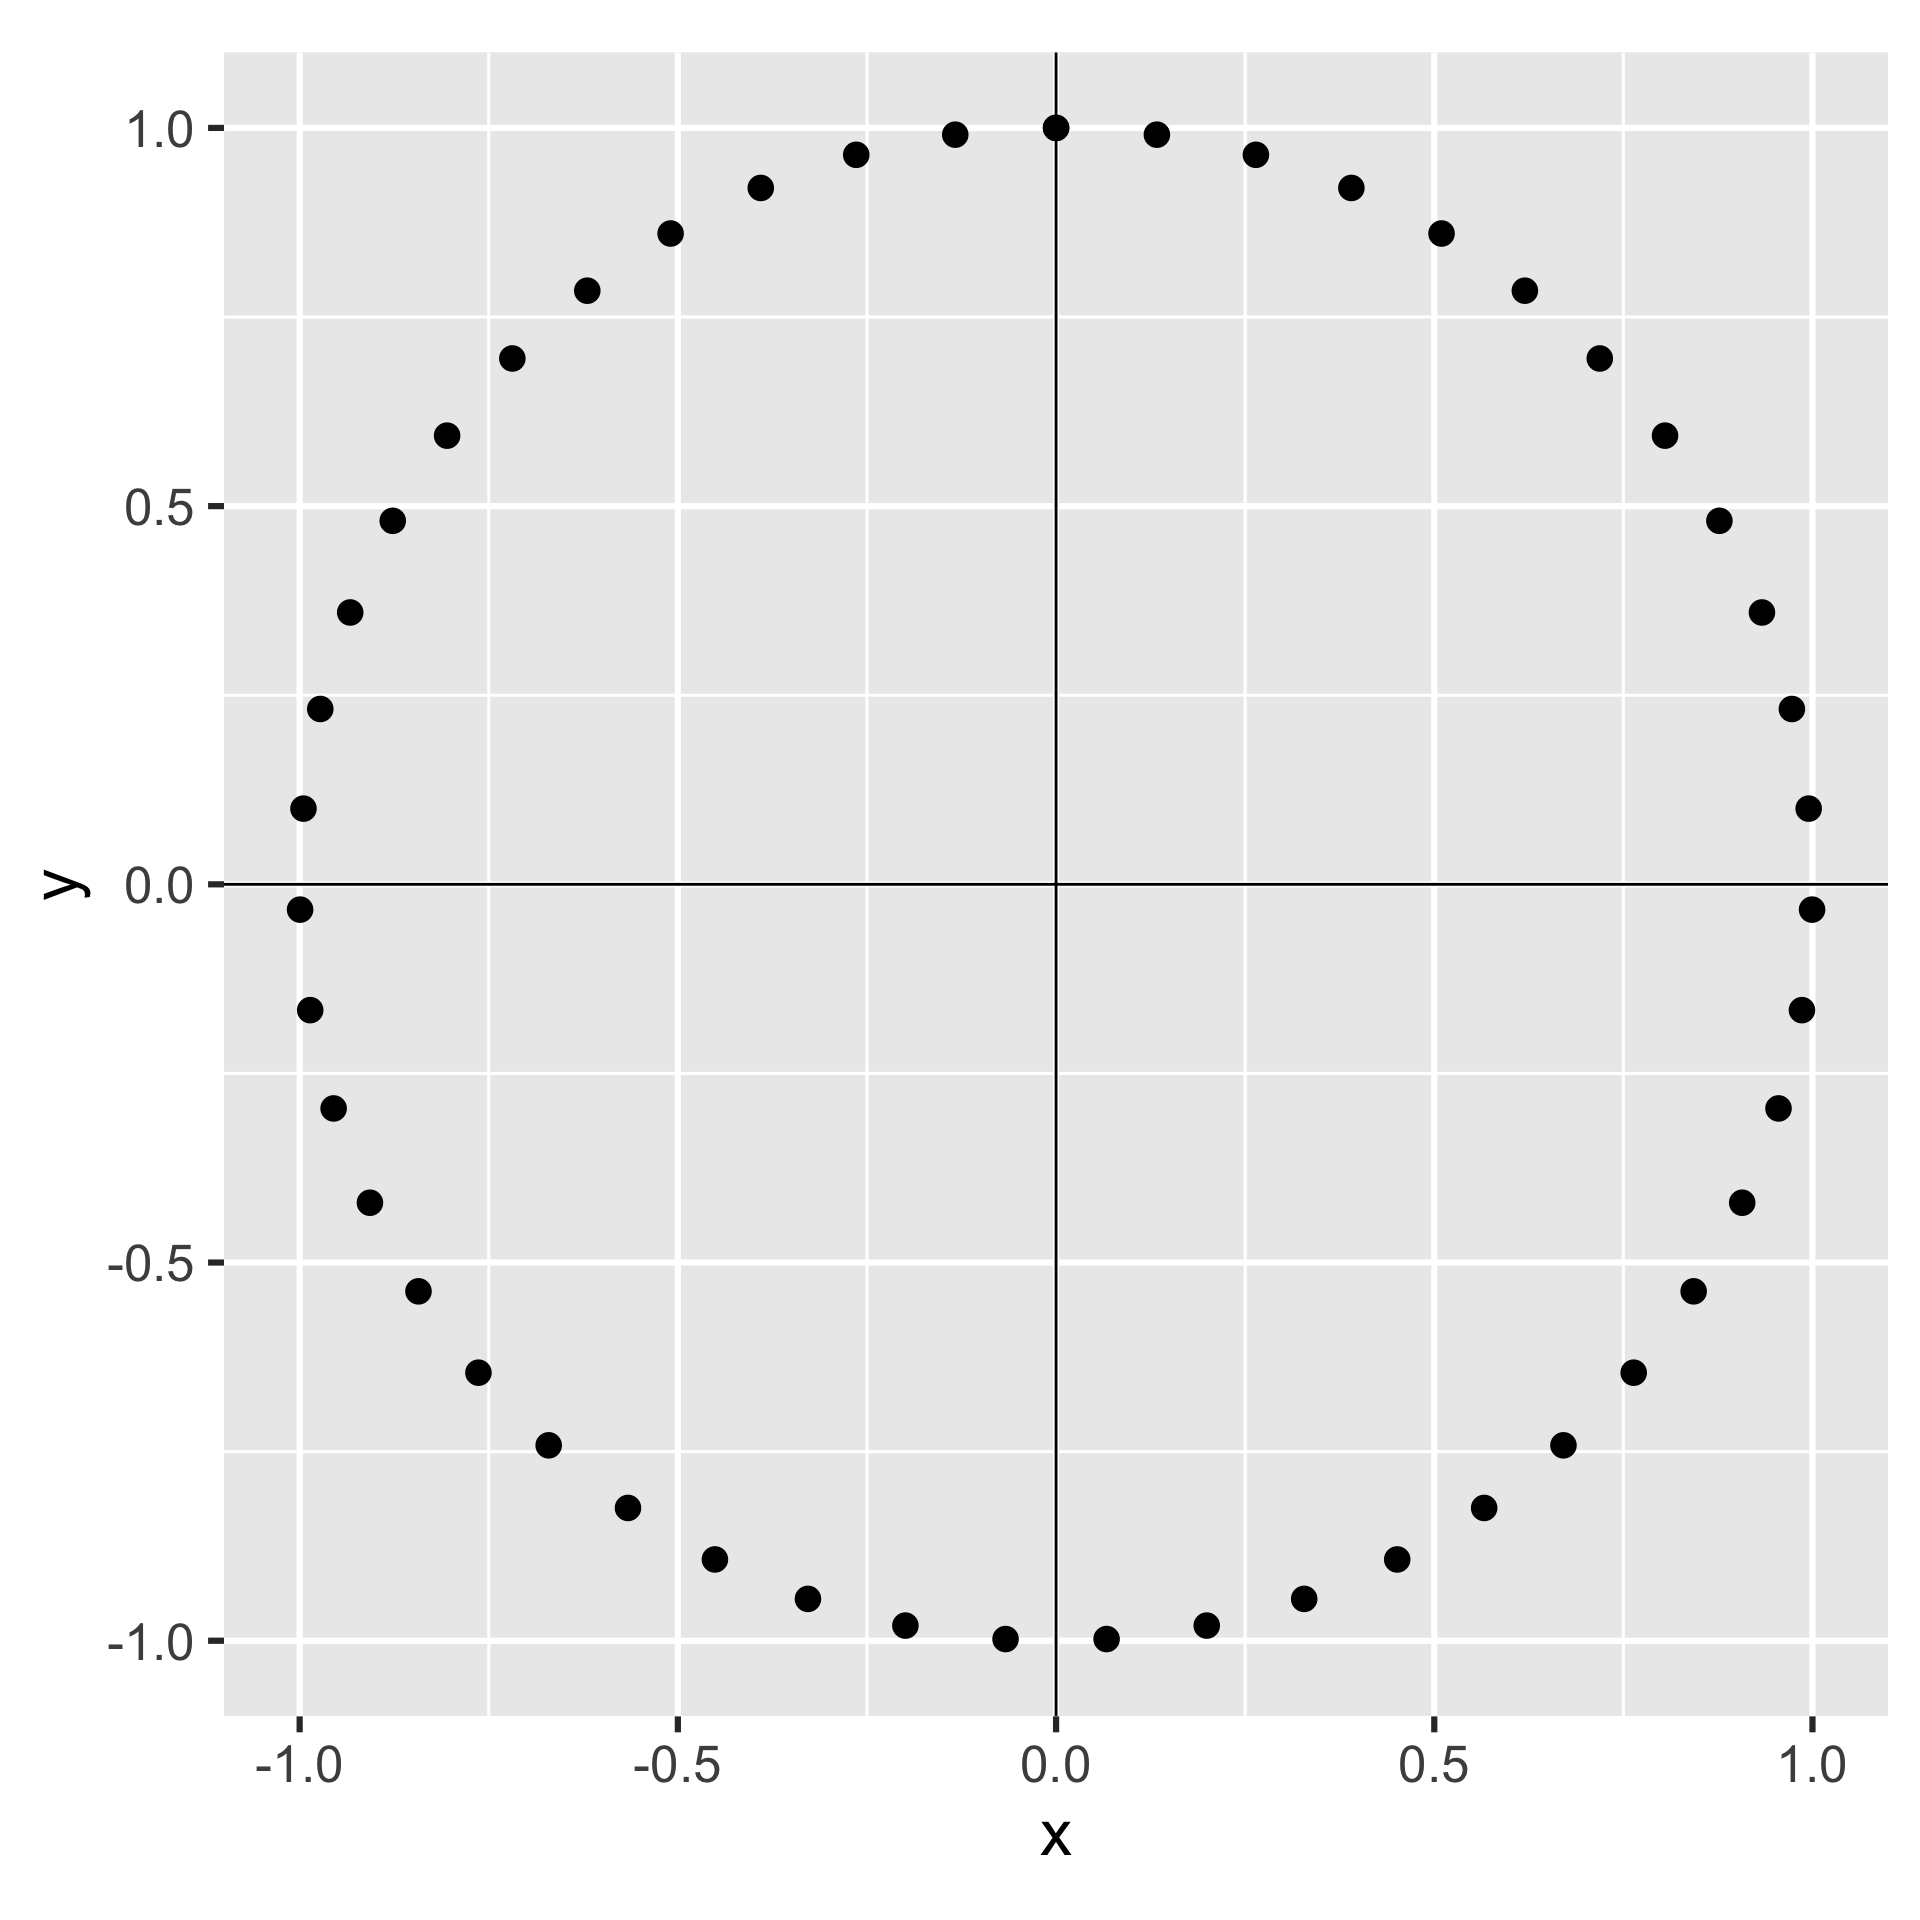
Making parts of circles
Another brief math interlude…
Making parts of circles
Another brief math interlude…
Making parts of circles
Another brief math interlude…
Making parts of circles
Another brief math interlude…
Making parts of circles
Another brief math interlude…
Making parts of circles
Another brief math interlude…
Making parts of circles
Another brief math interlude…
Making parts of circles
Another brief math interlude…
Making parts of circles
Another brief math interlude…
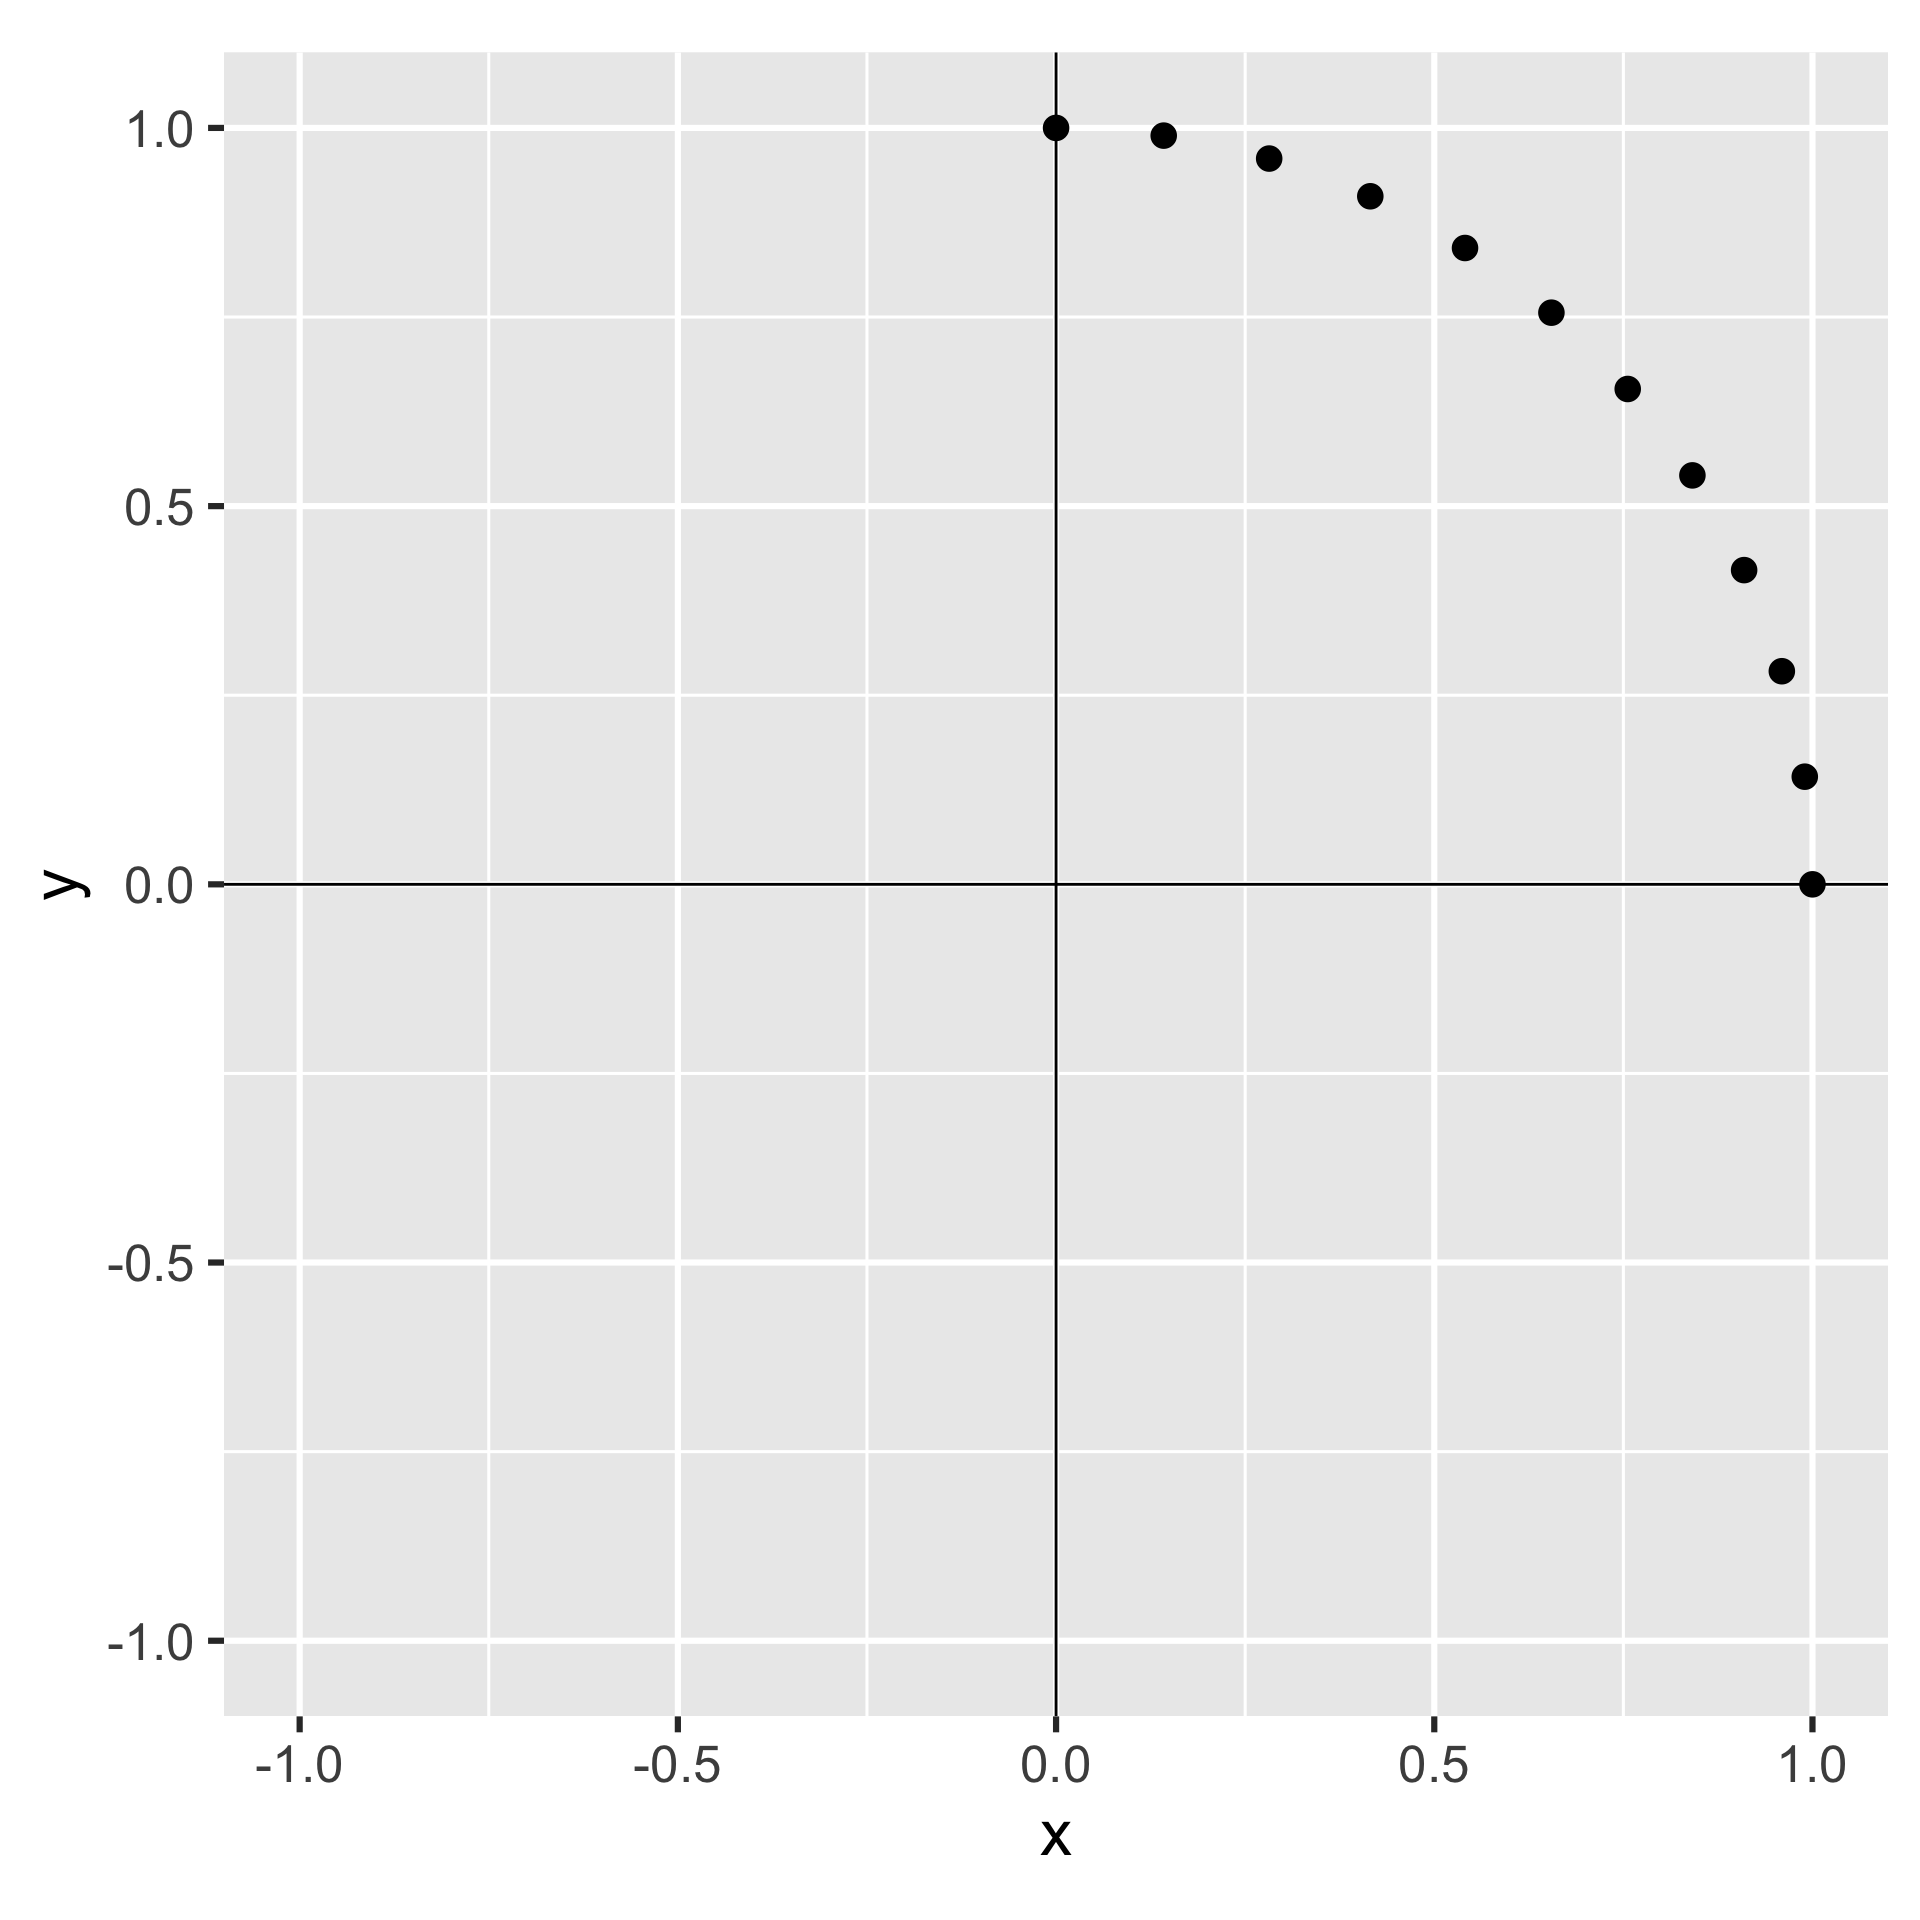
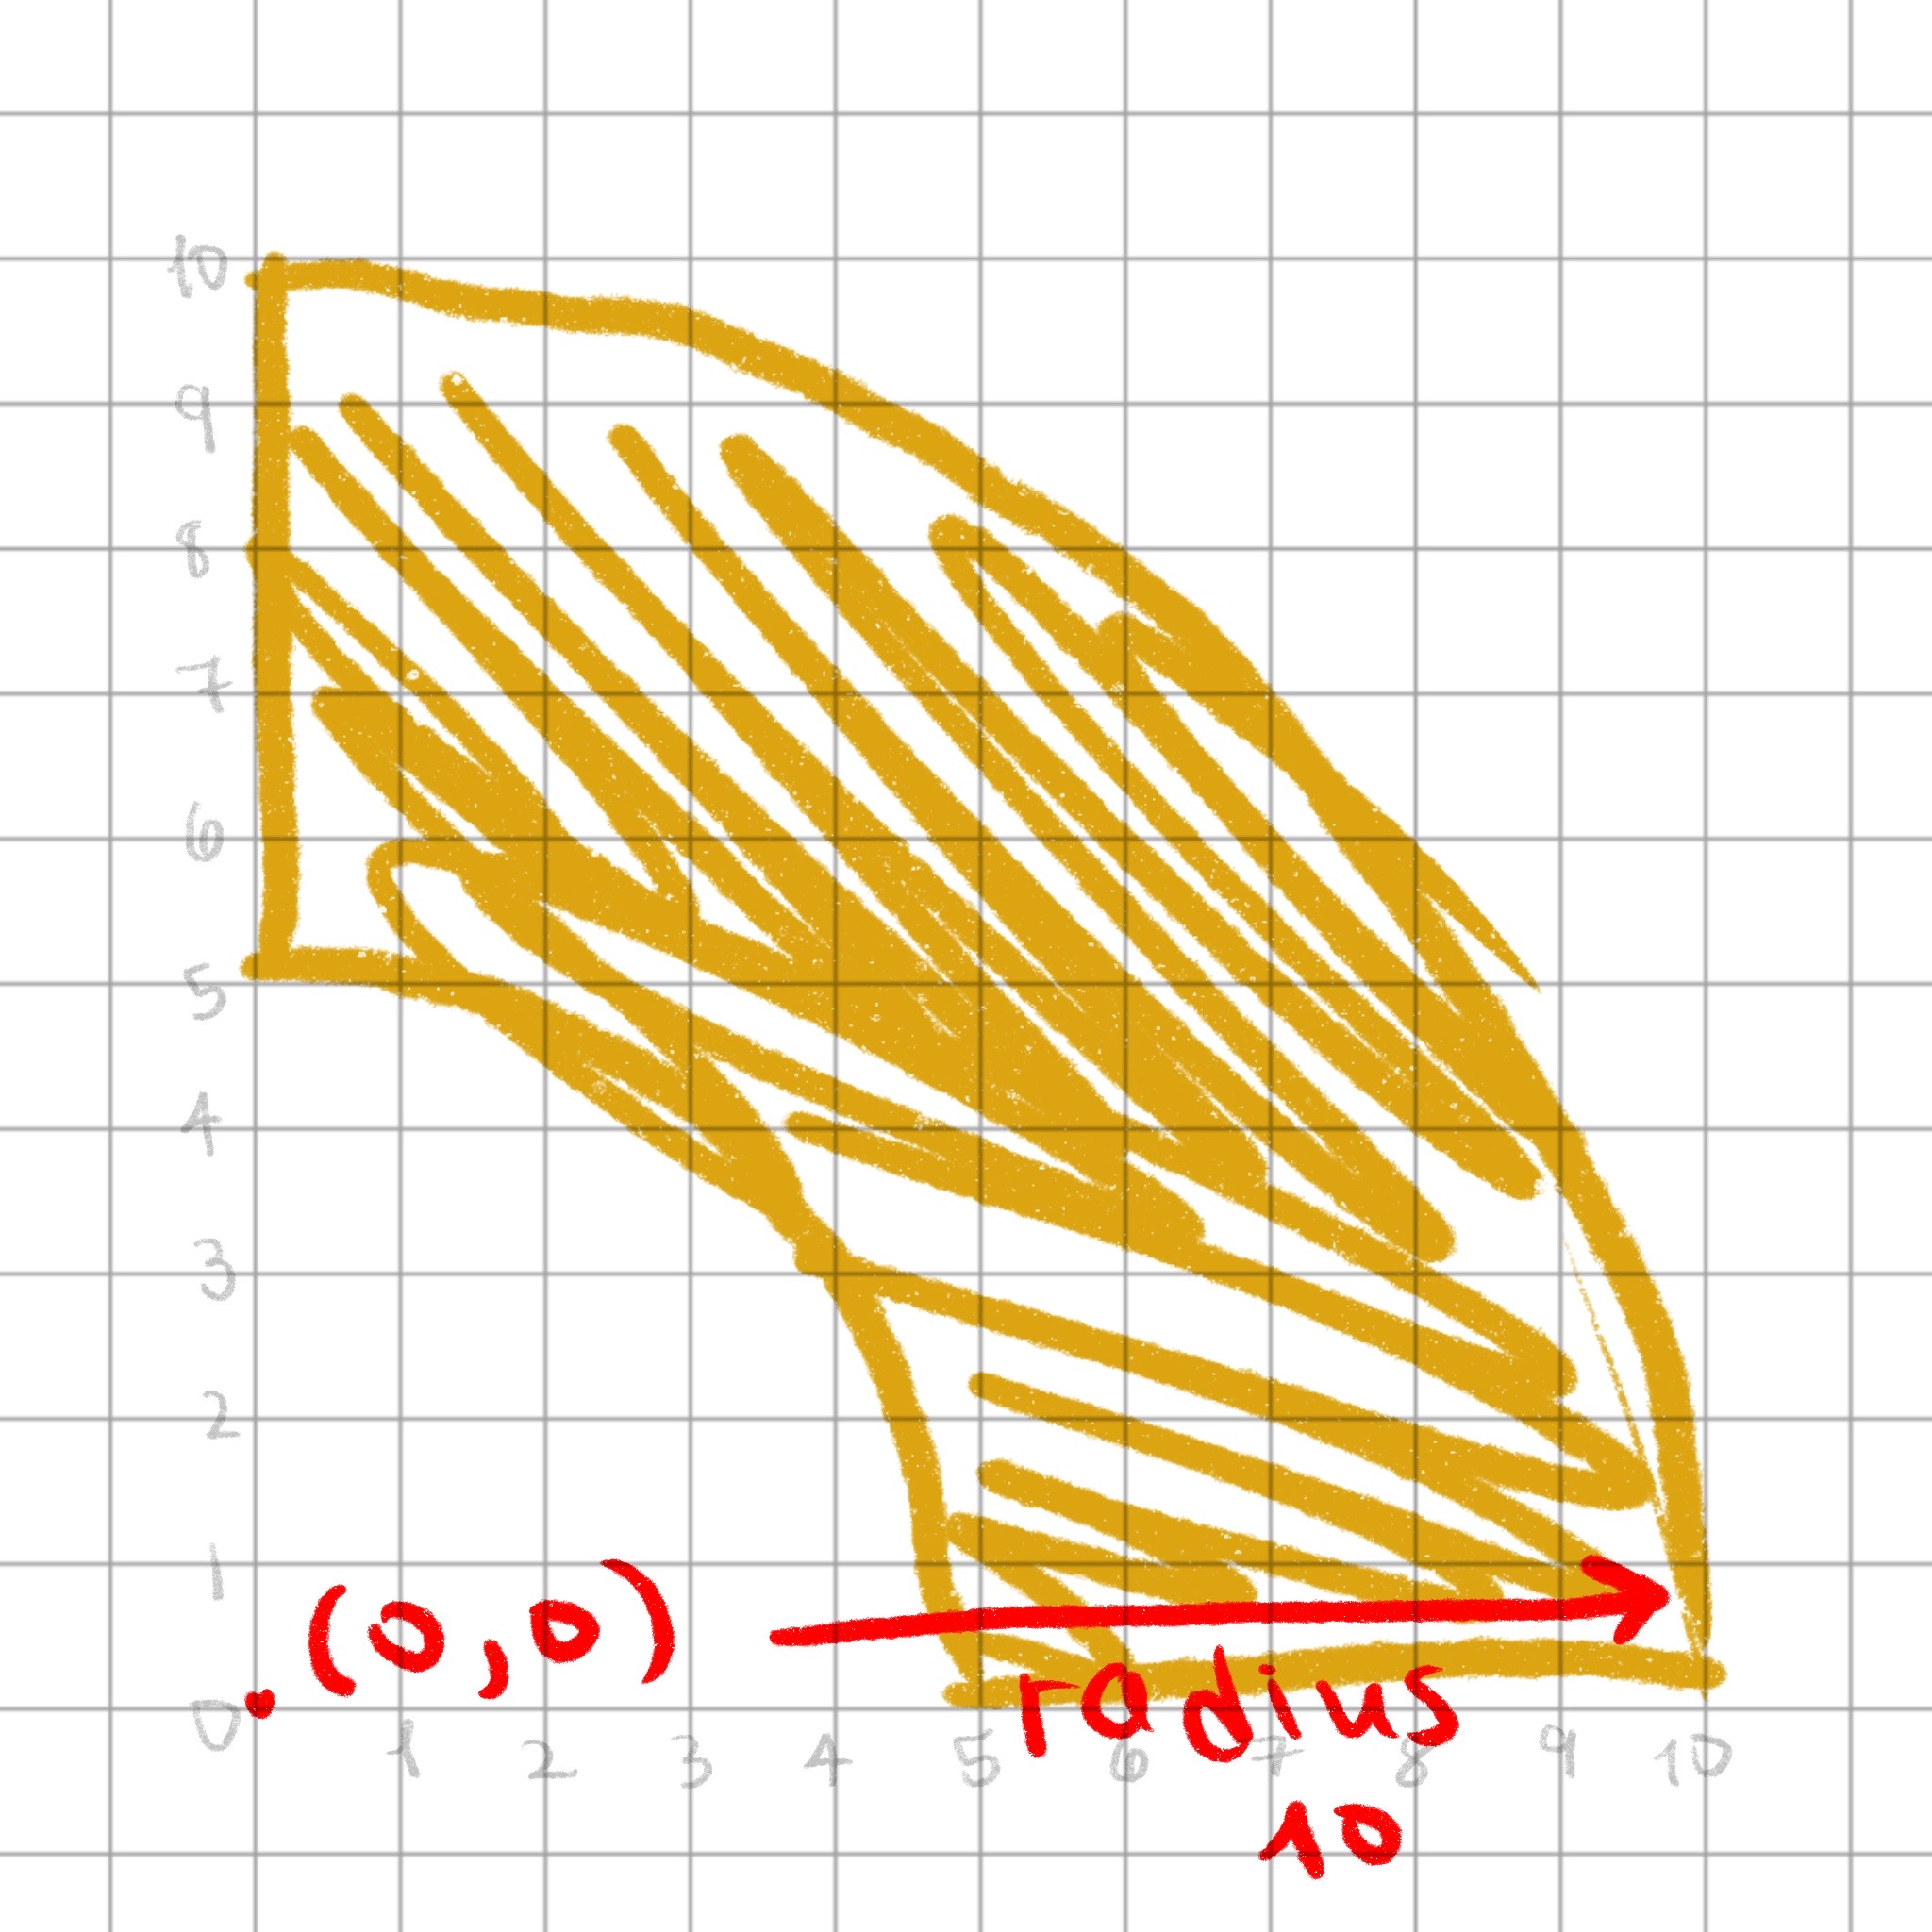
geom_arc_bar is used to make parts of circles
x0,y0: center of circler: radius of circlestart: starting angleend: ending angle
Making parts of circles
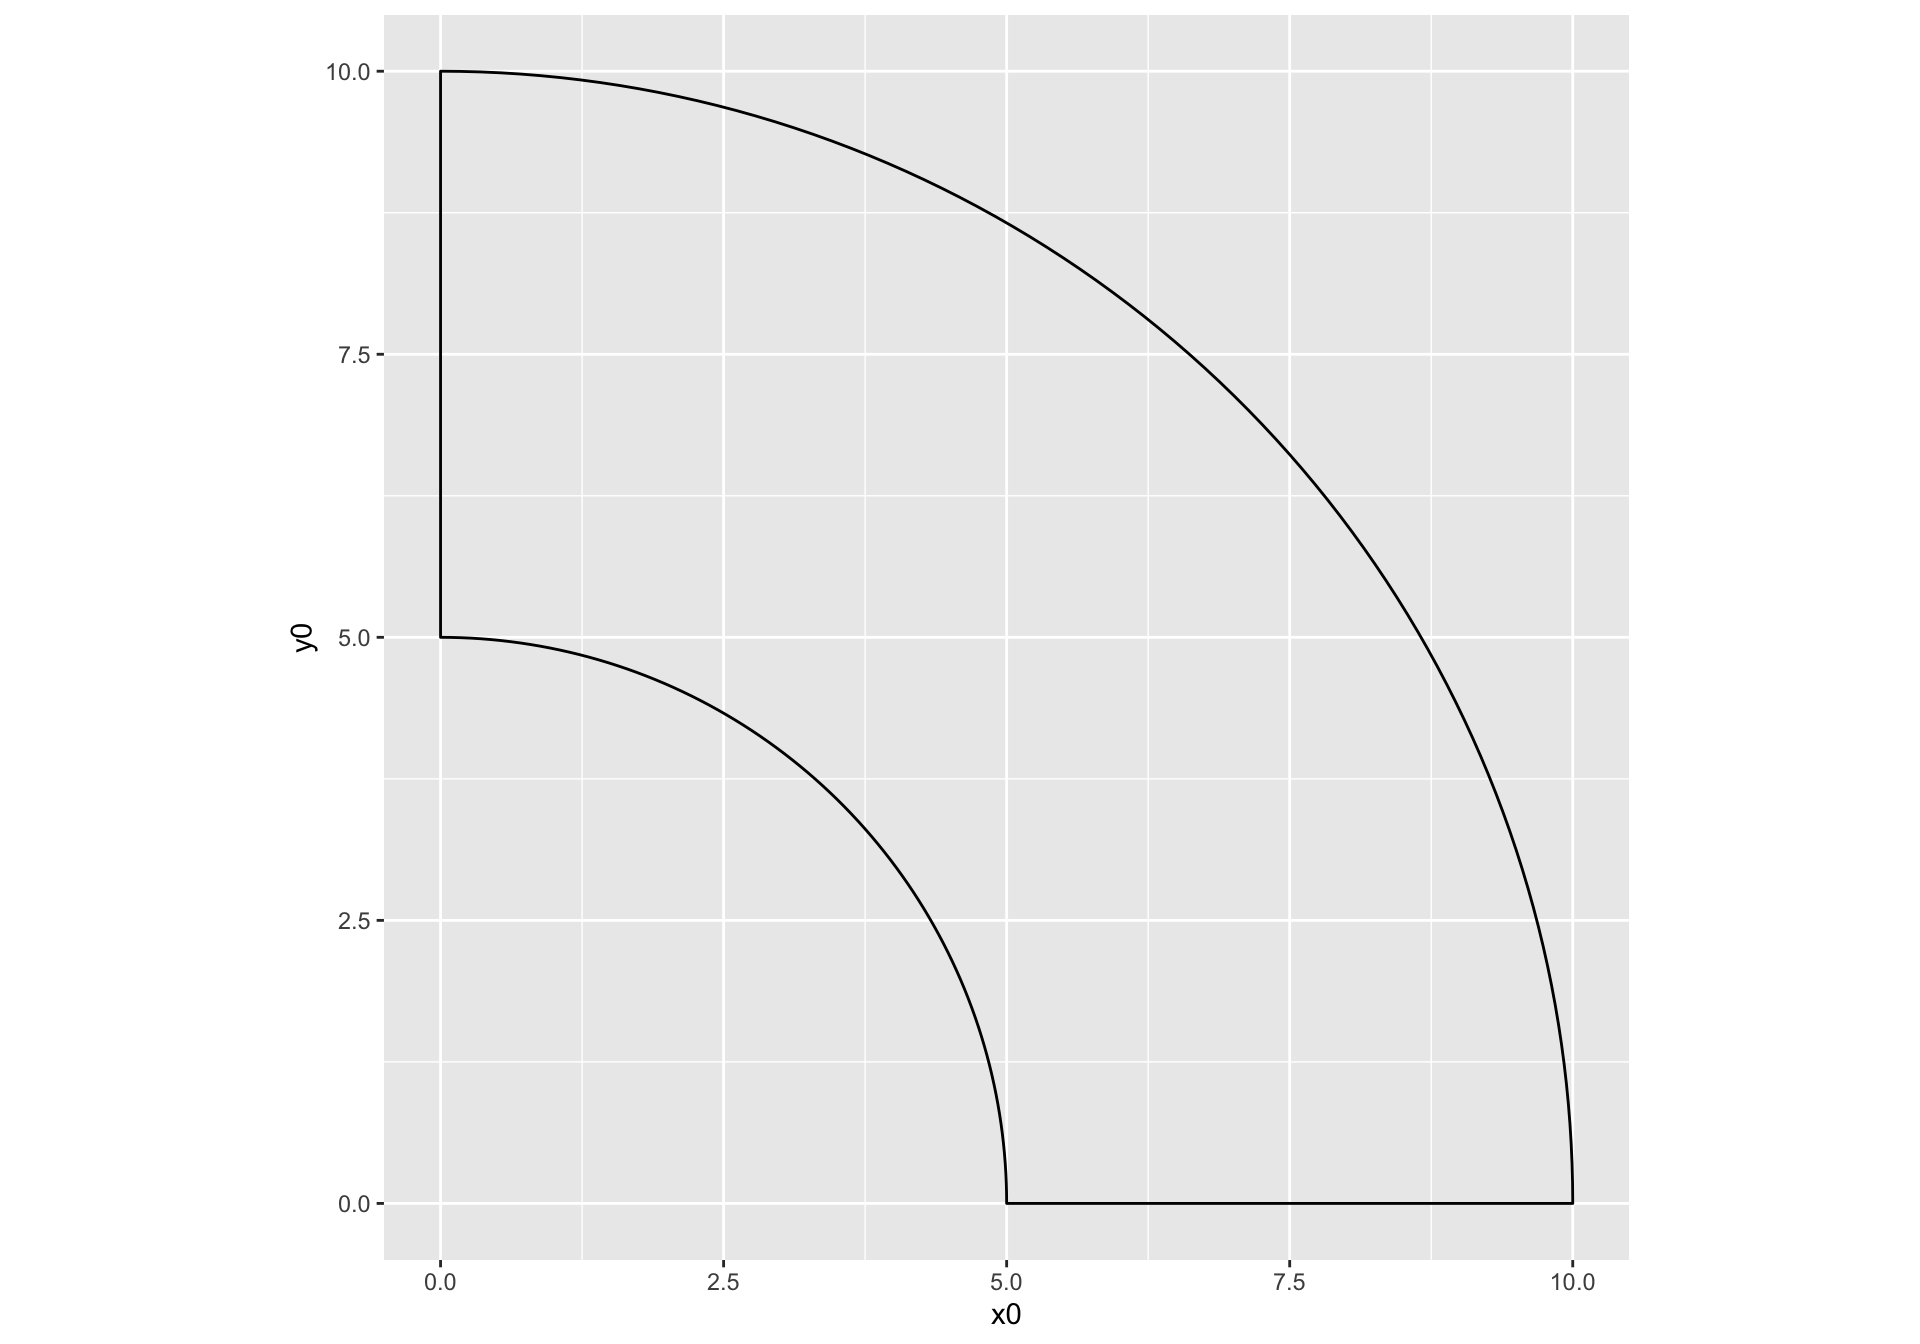
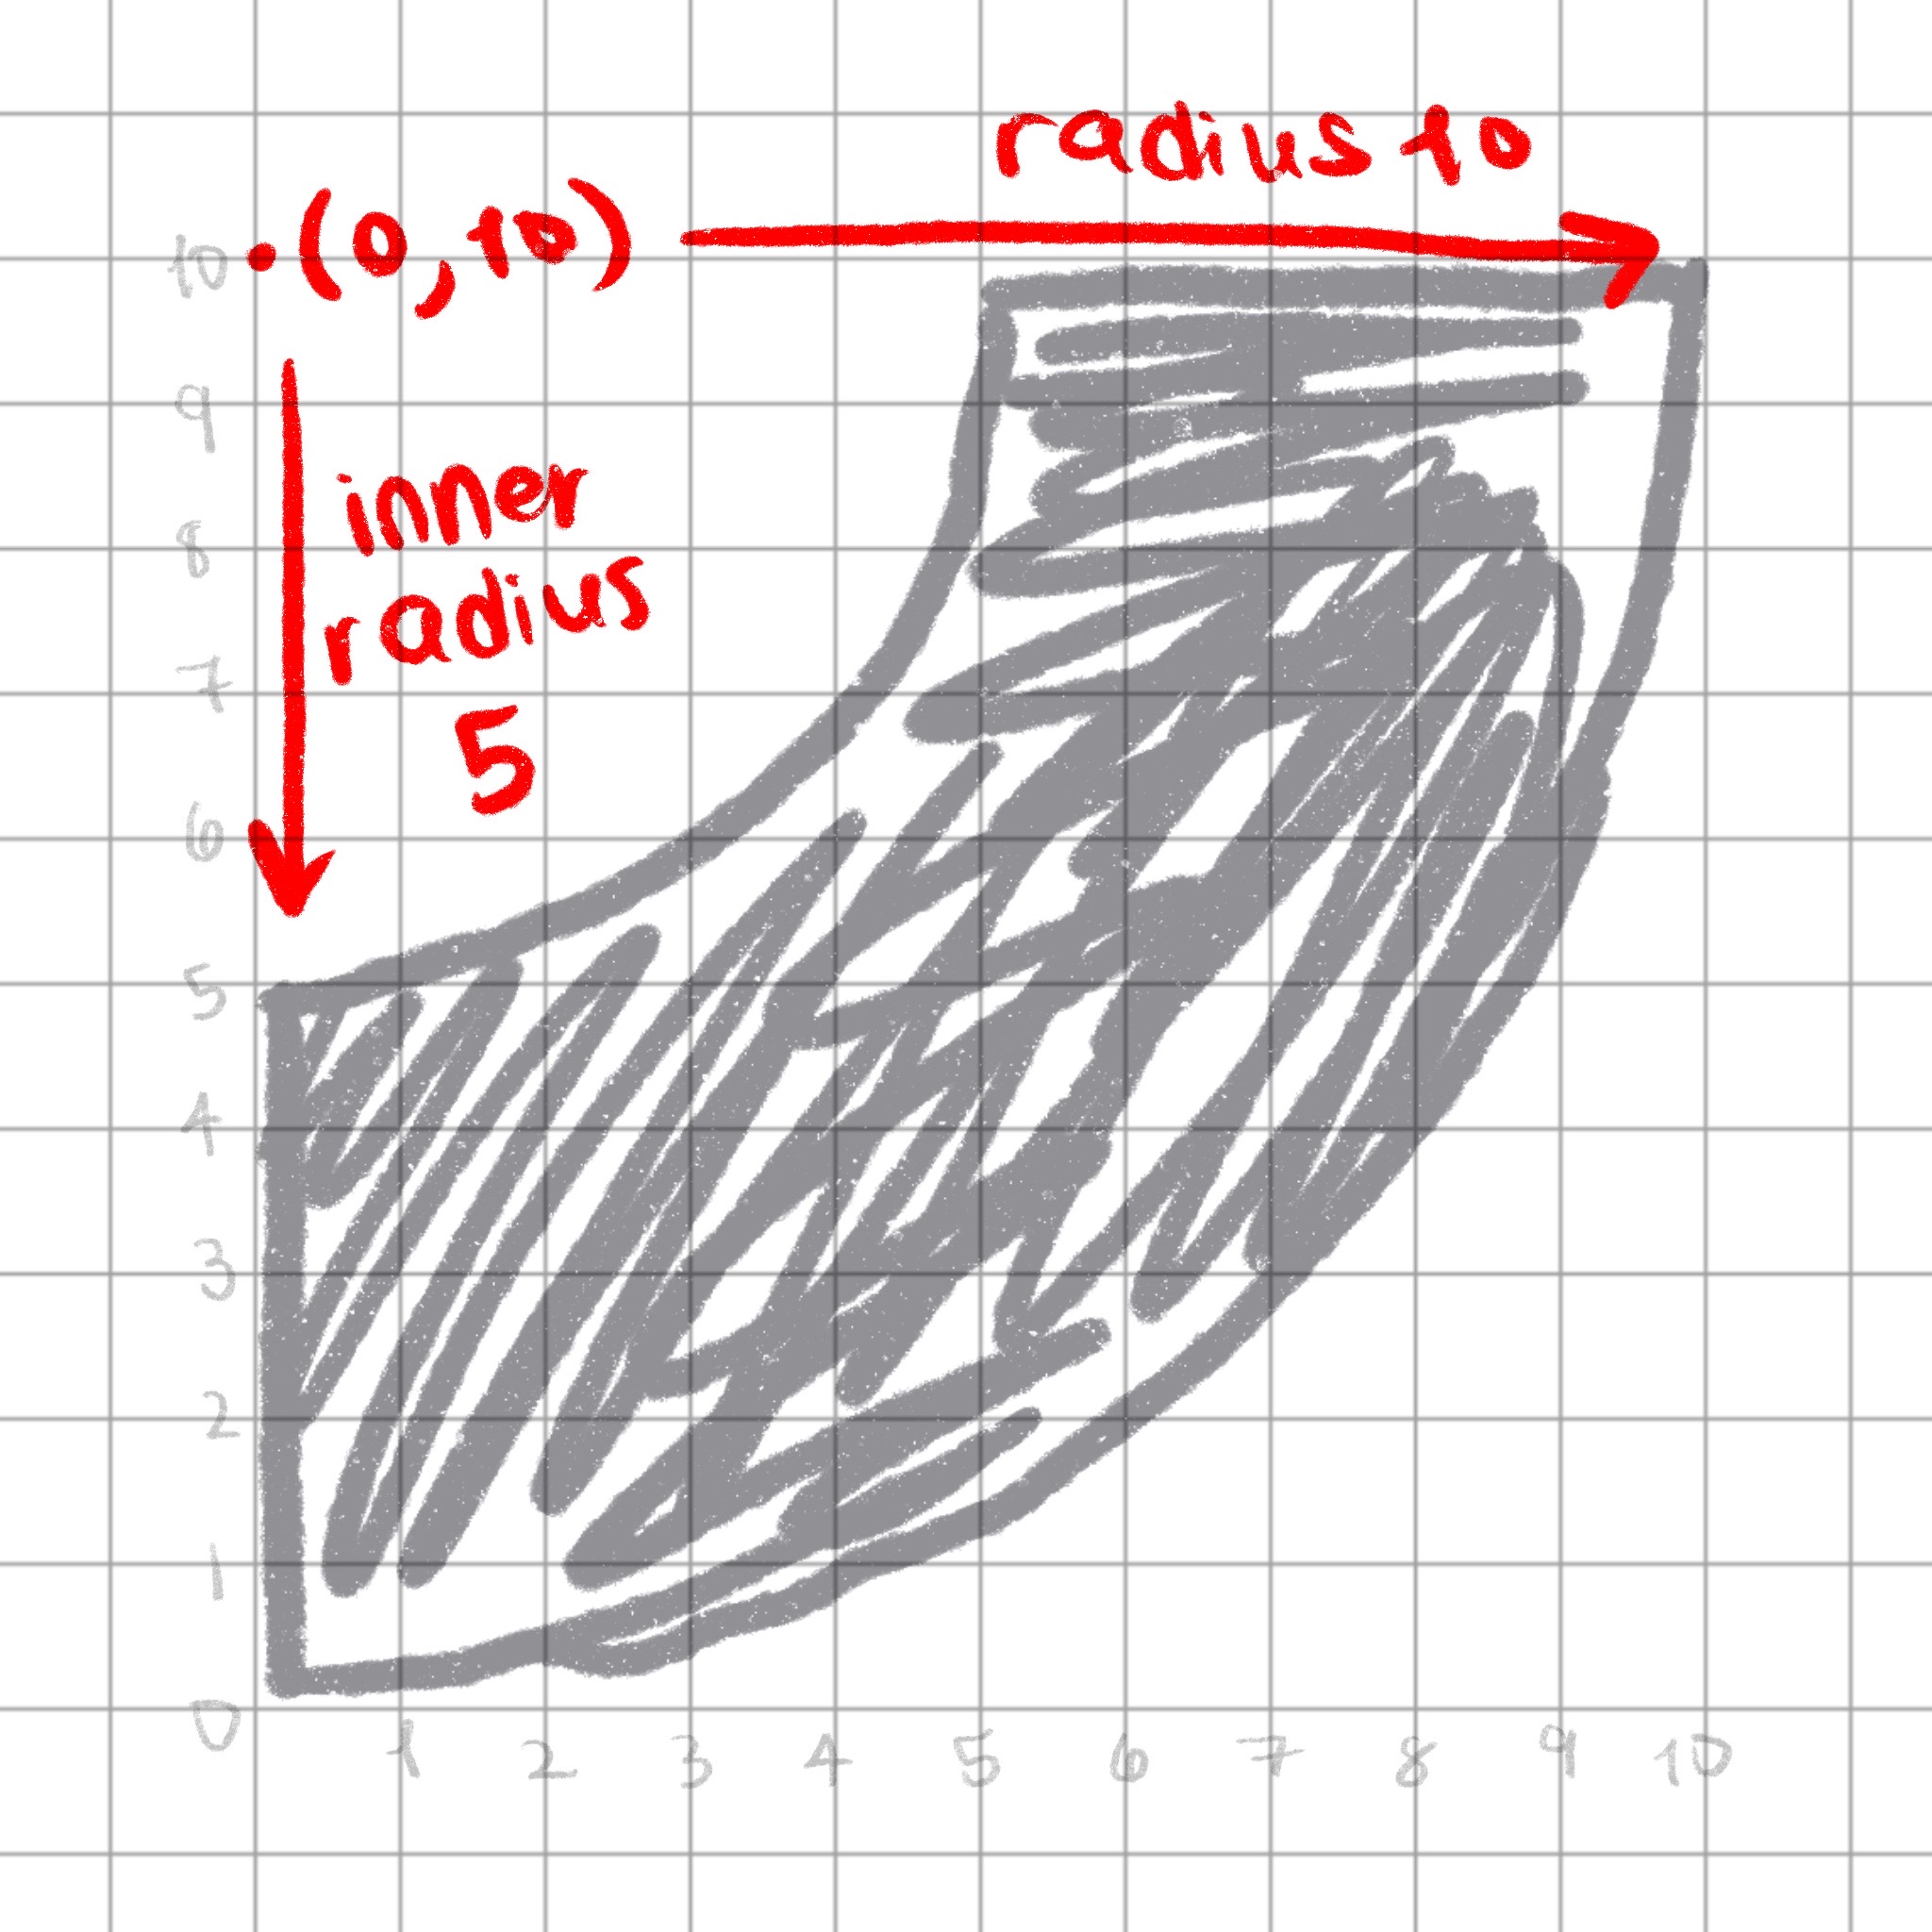
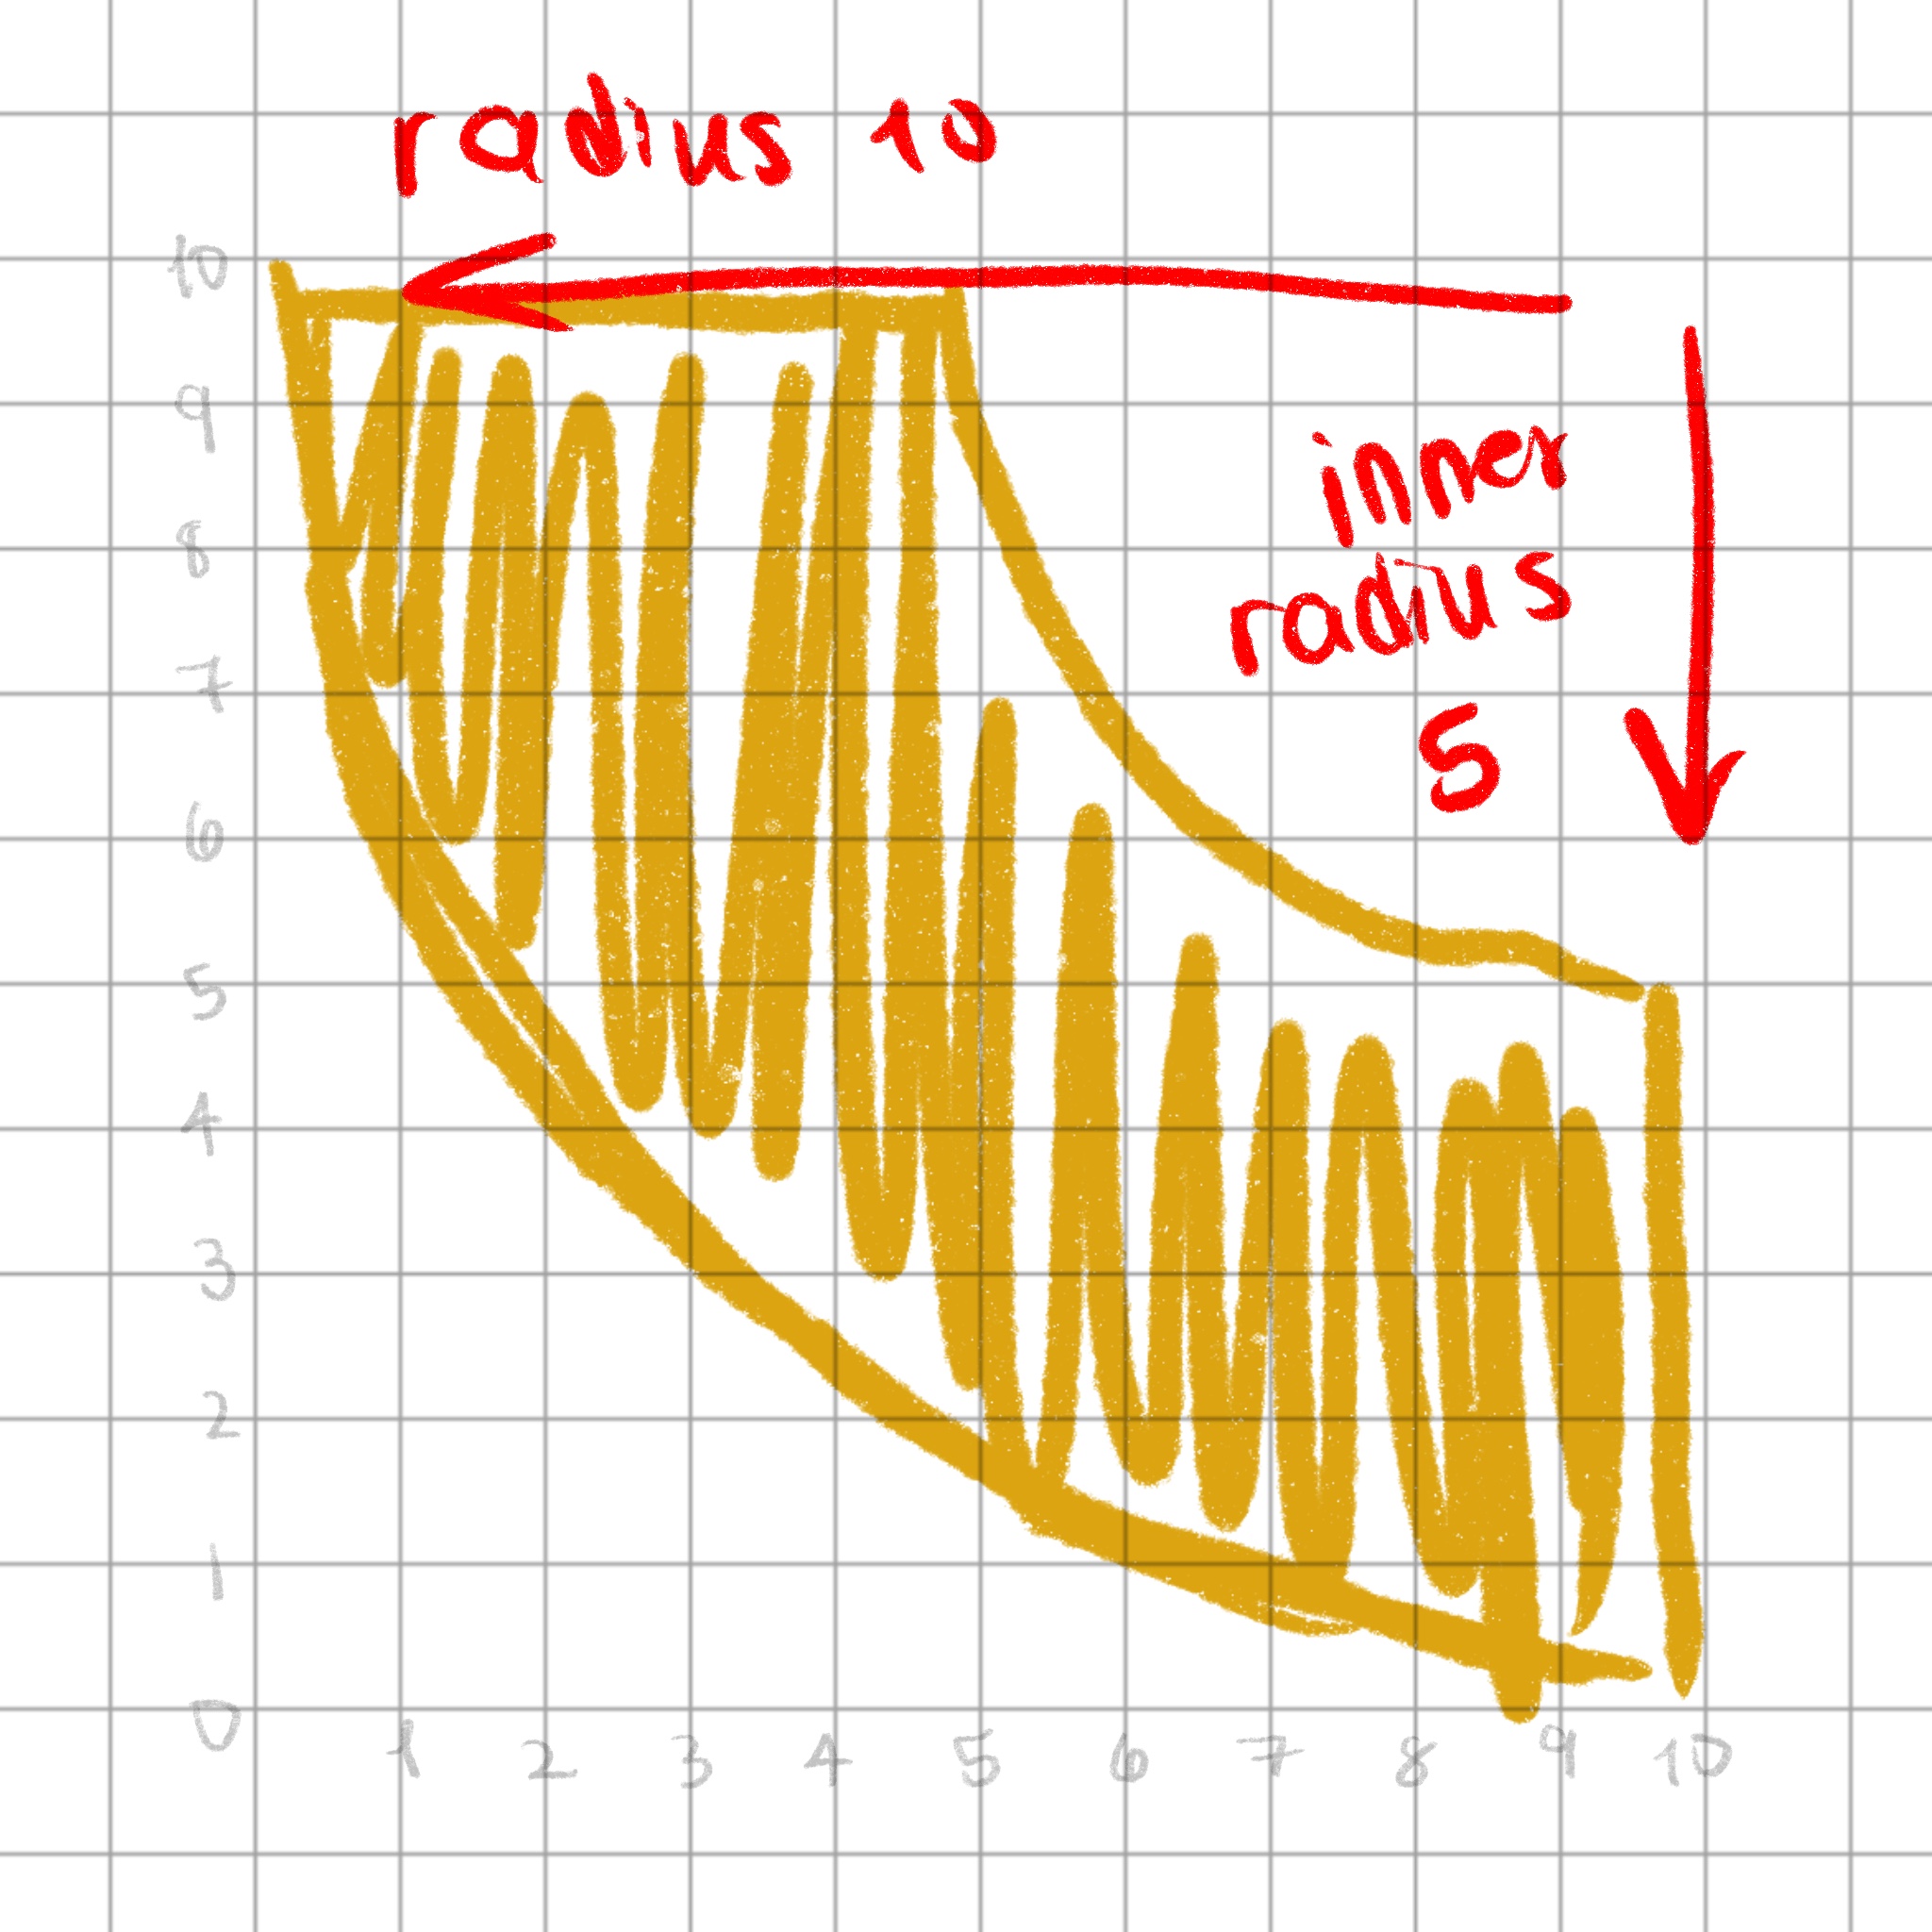
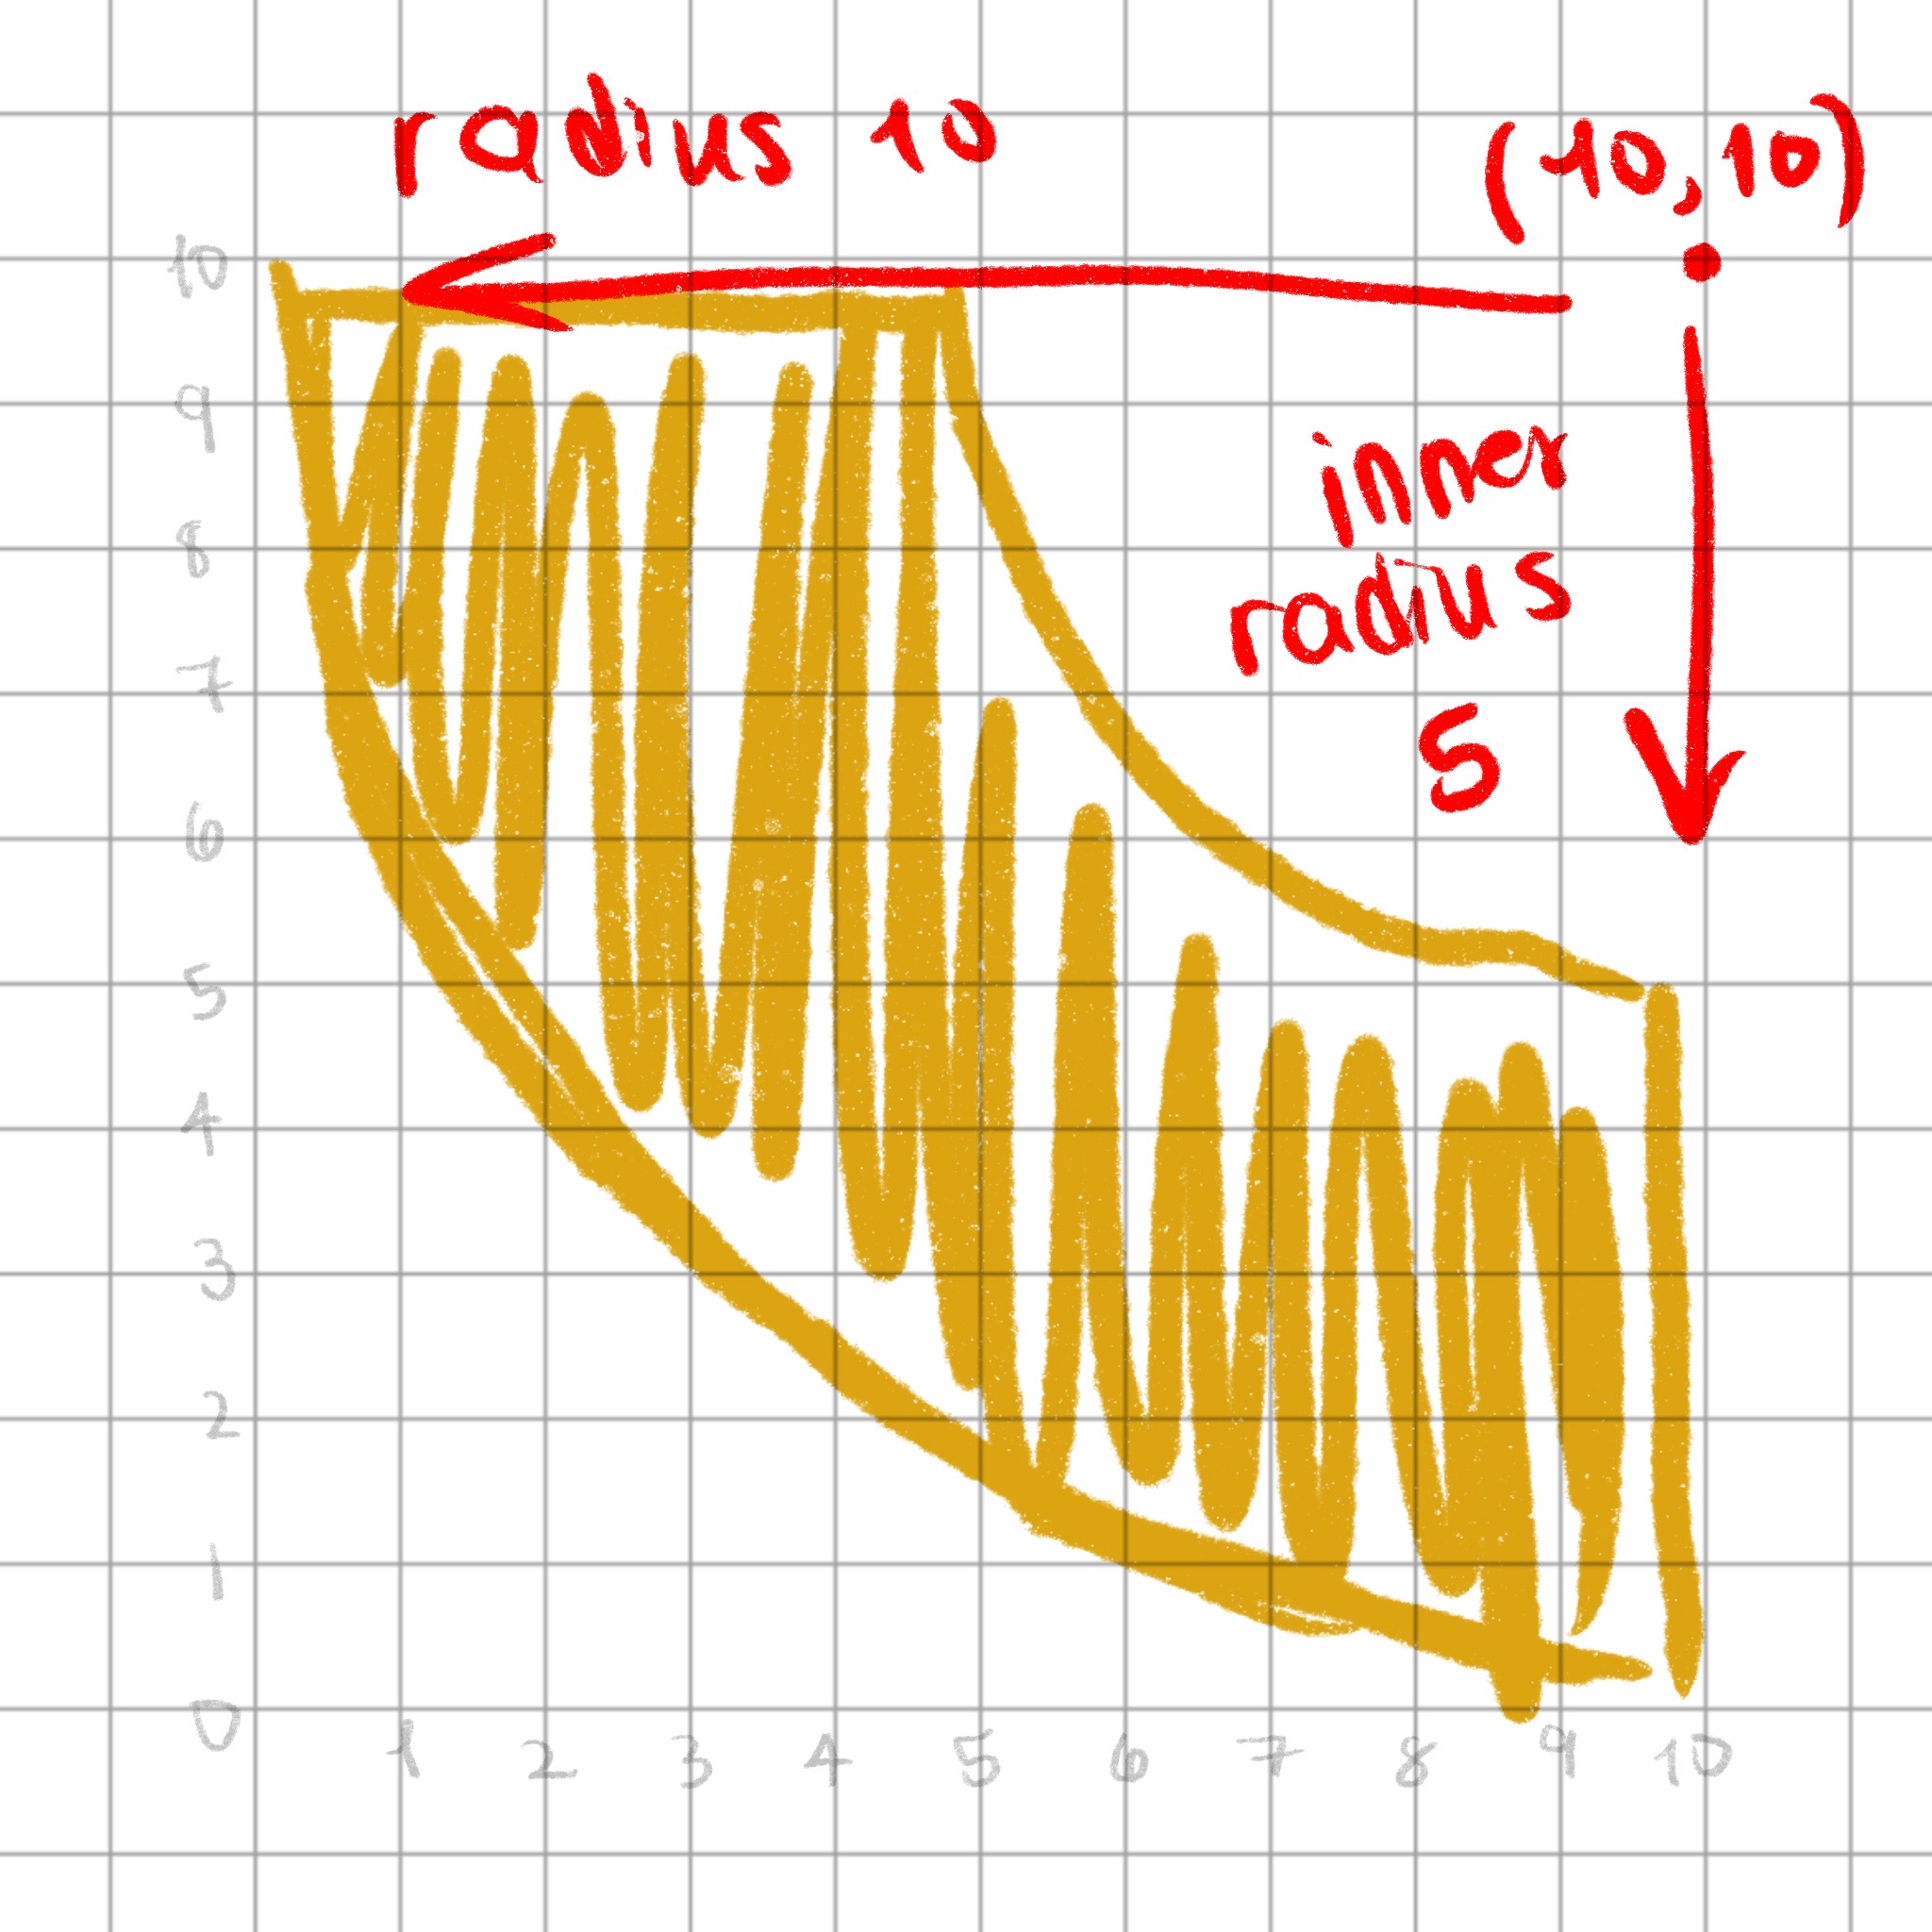
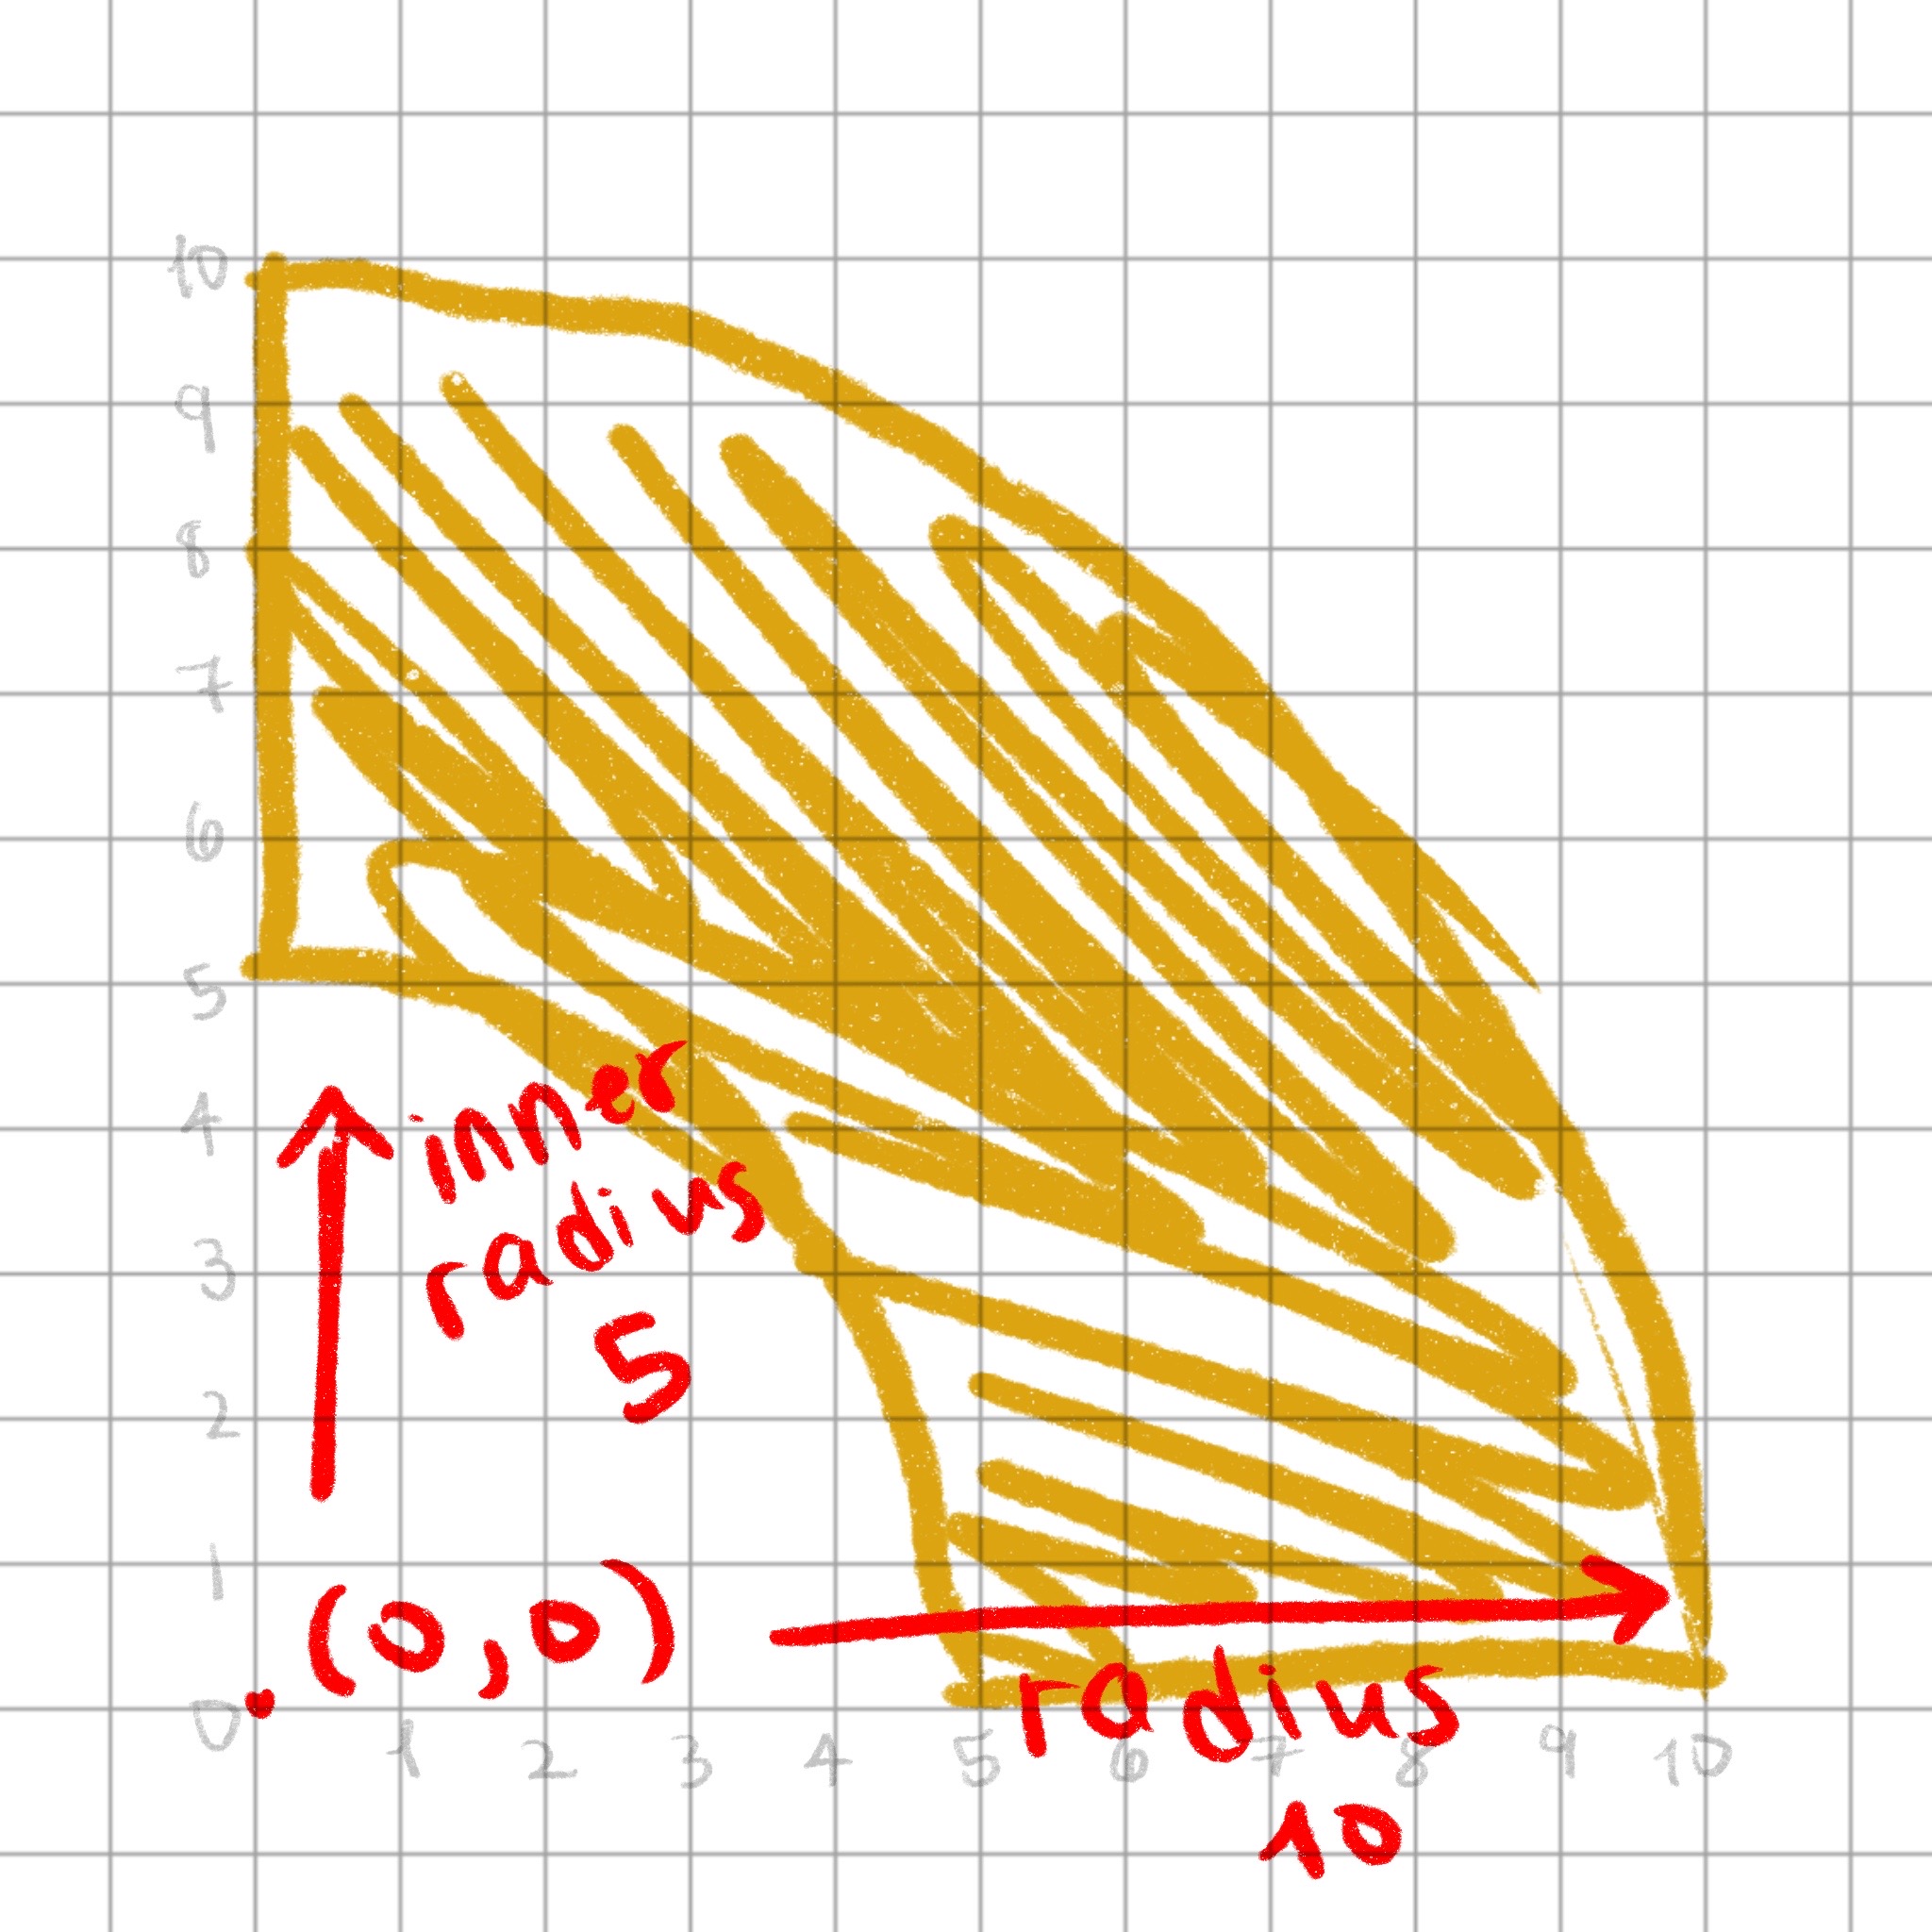
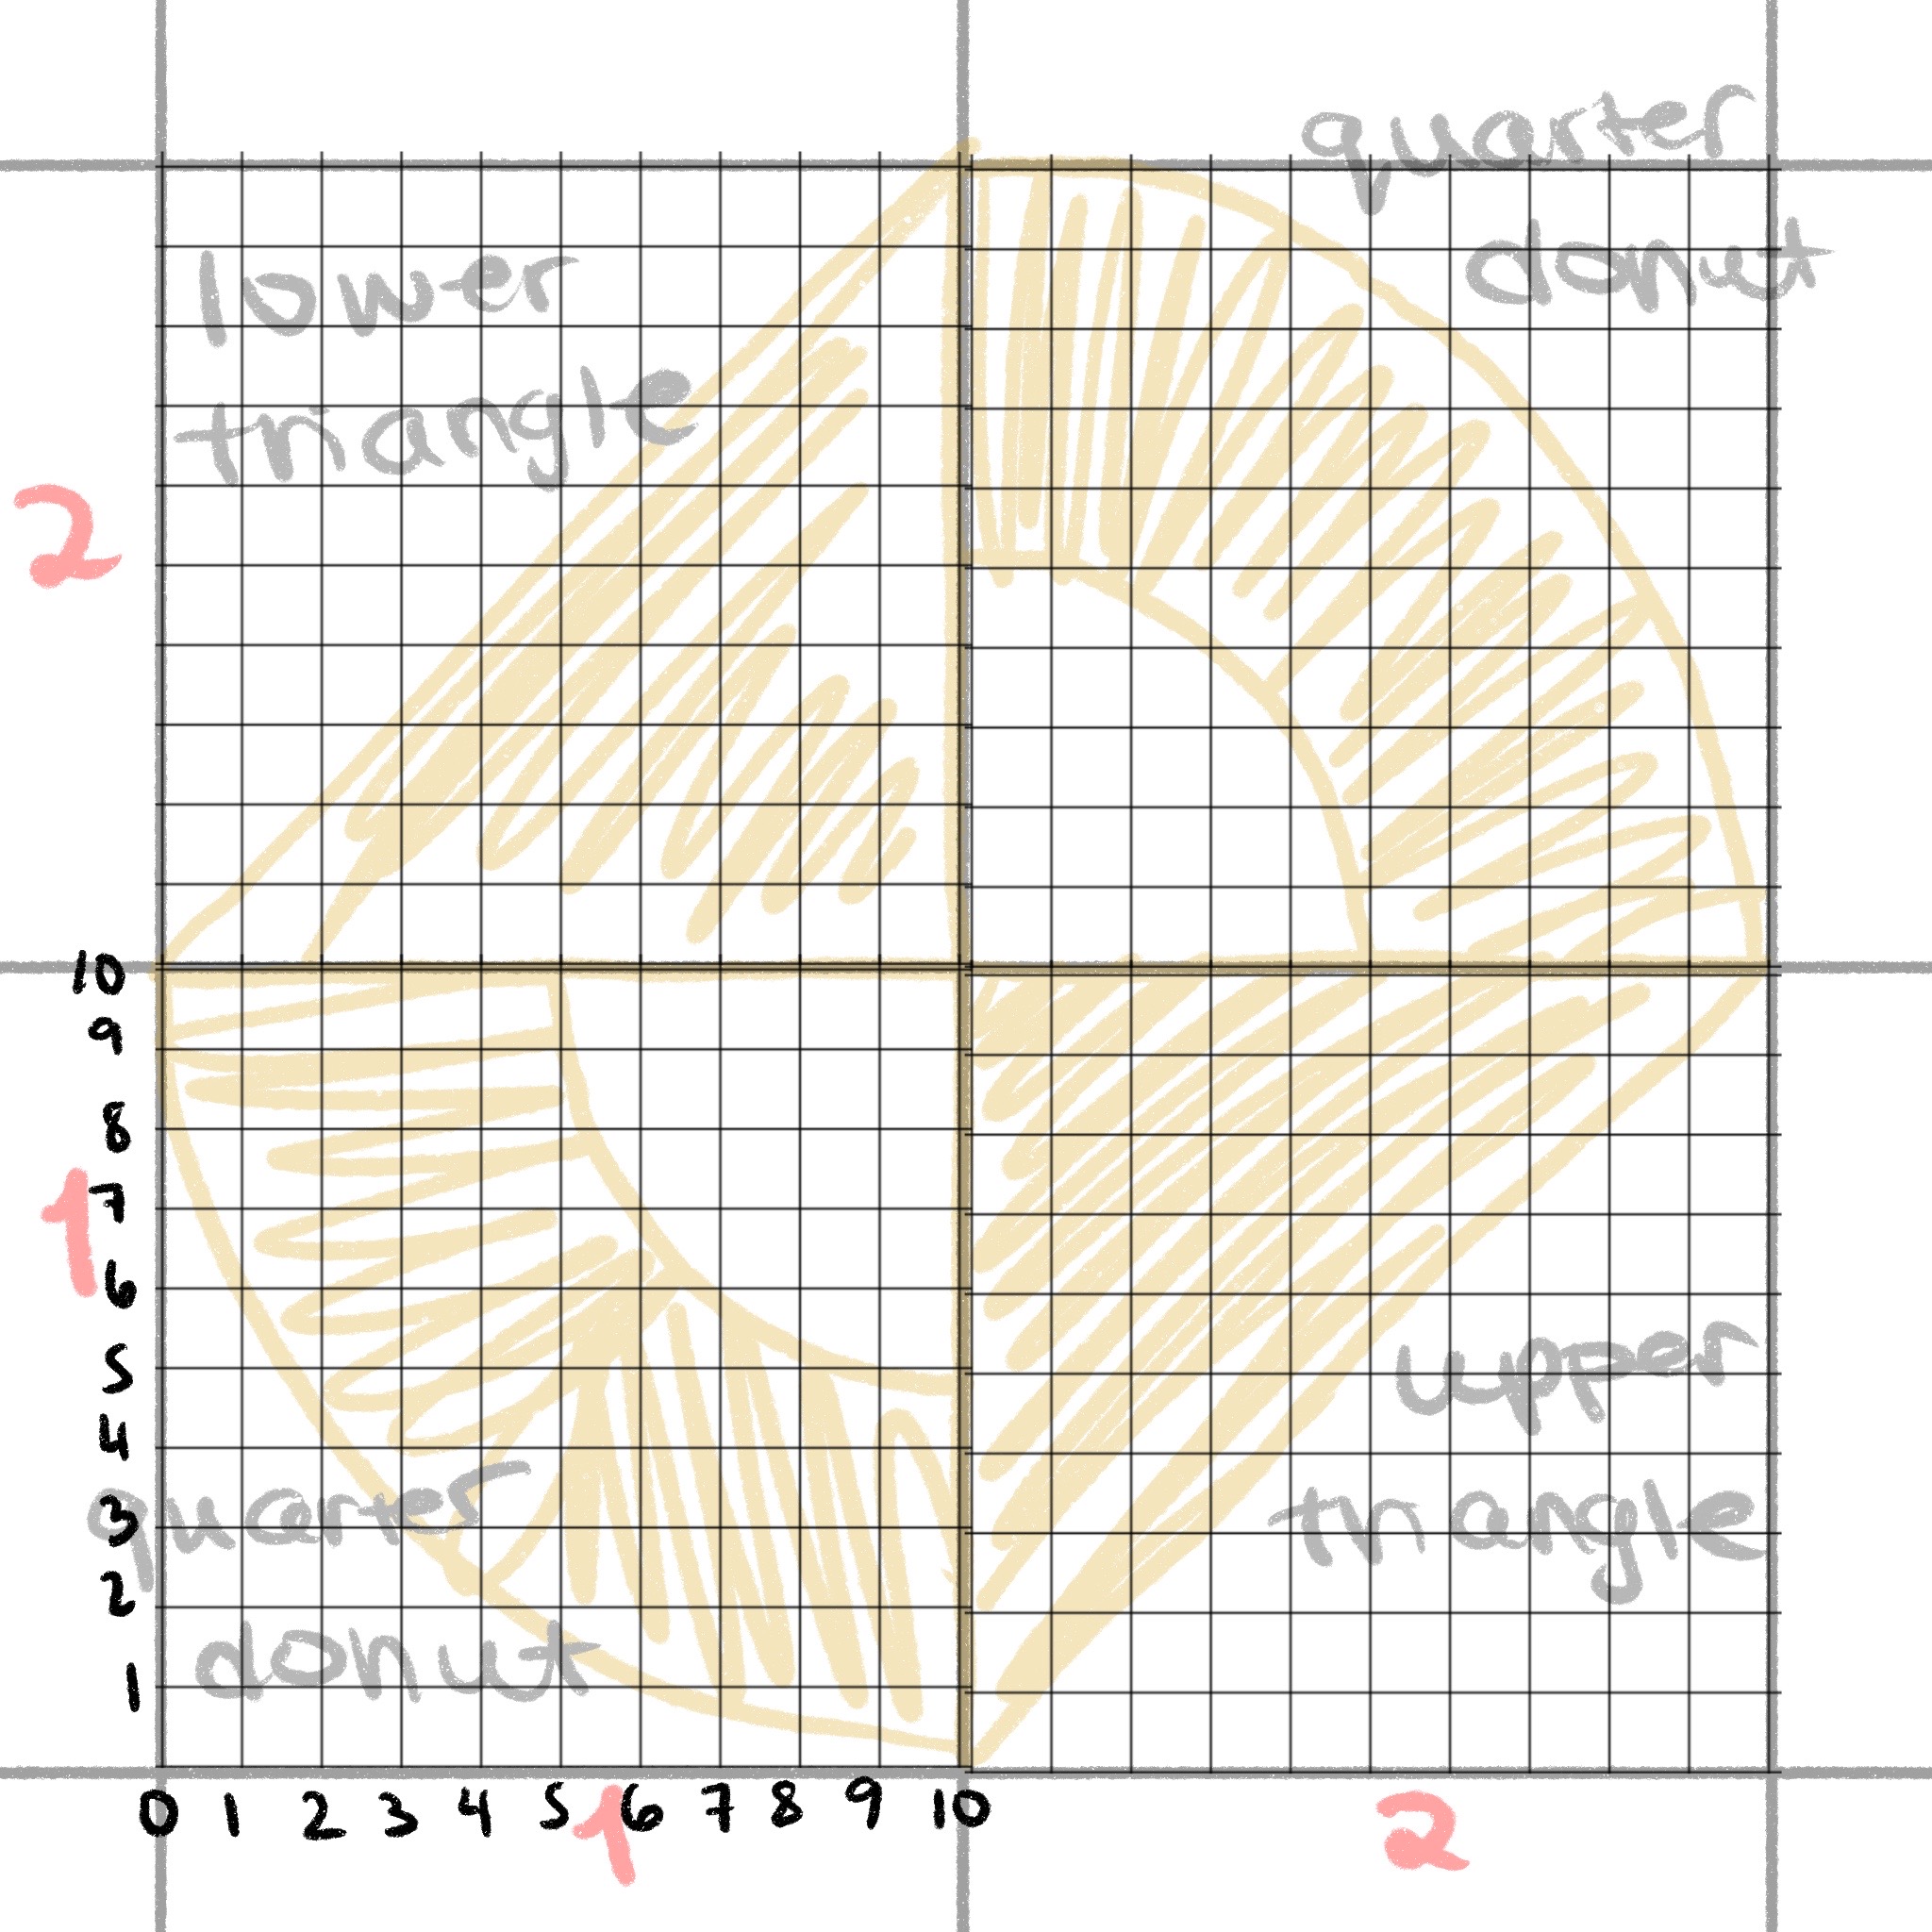
Making parts of donuts
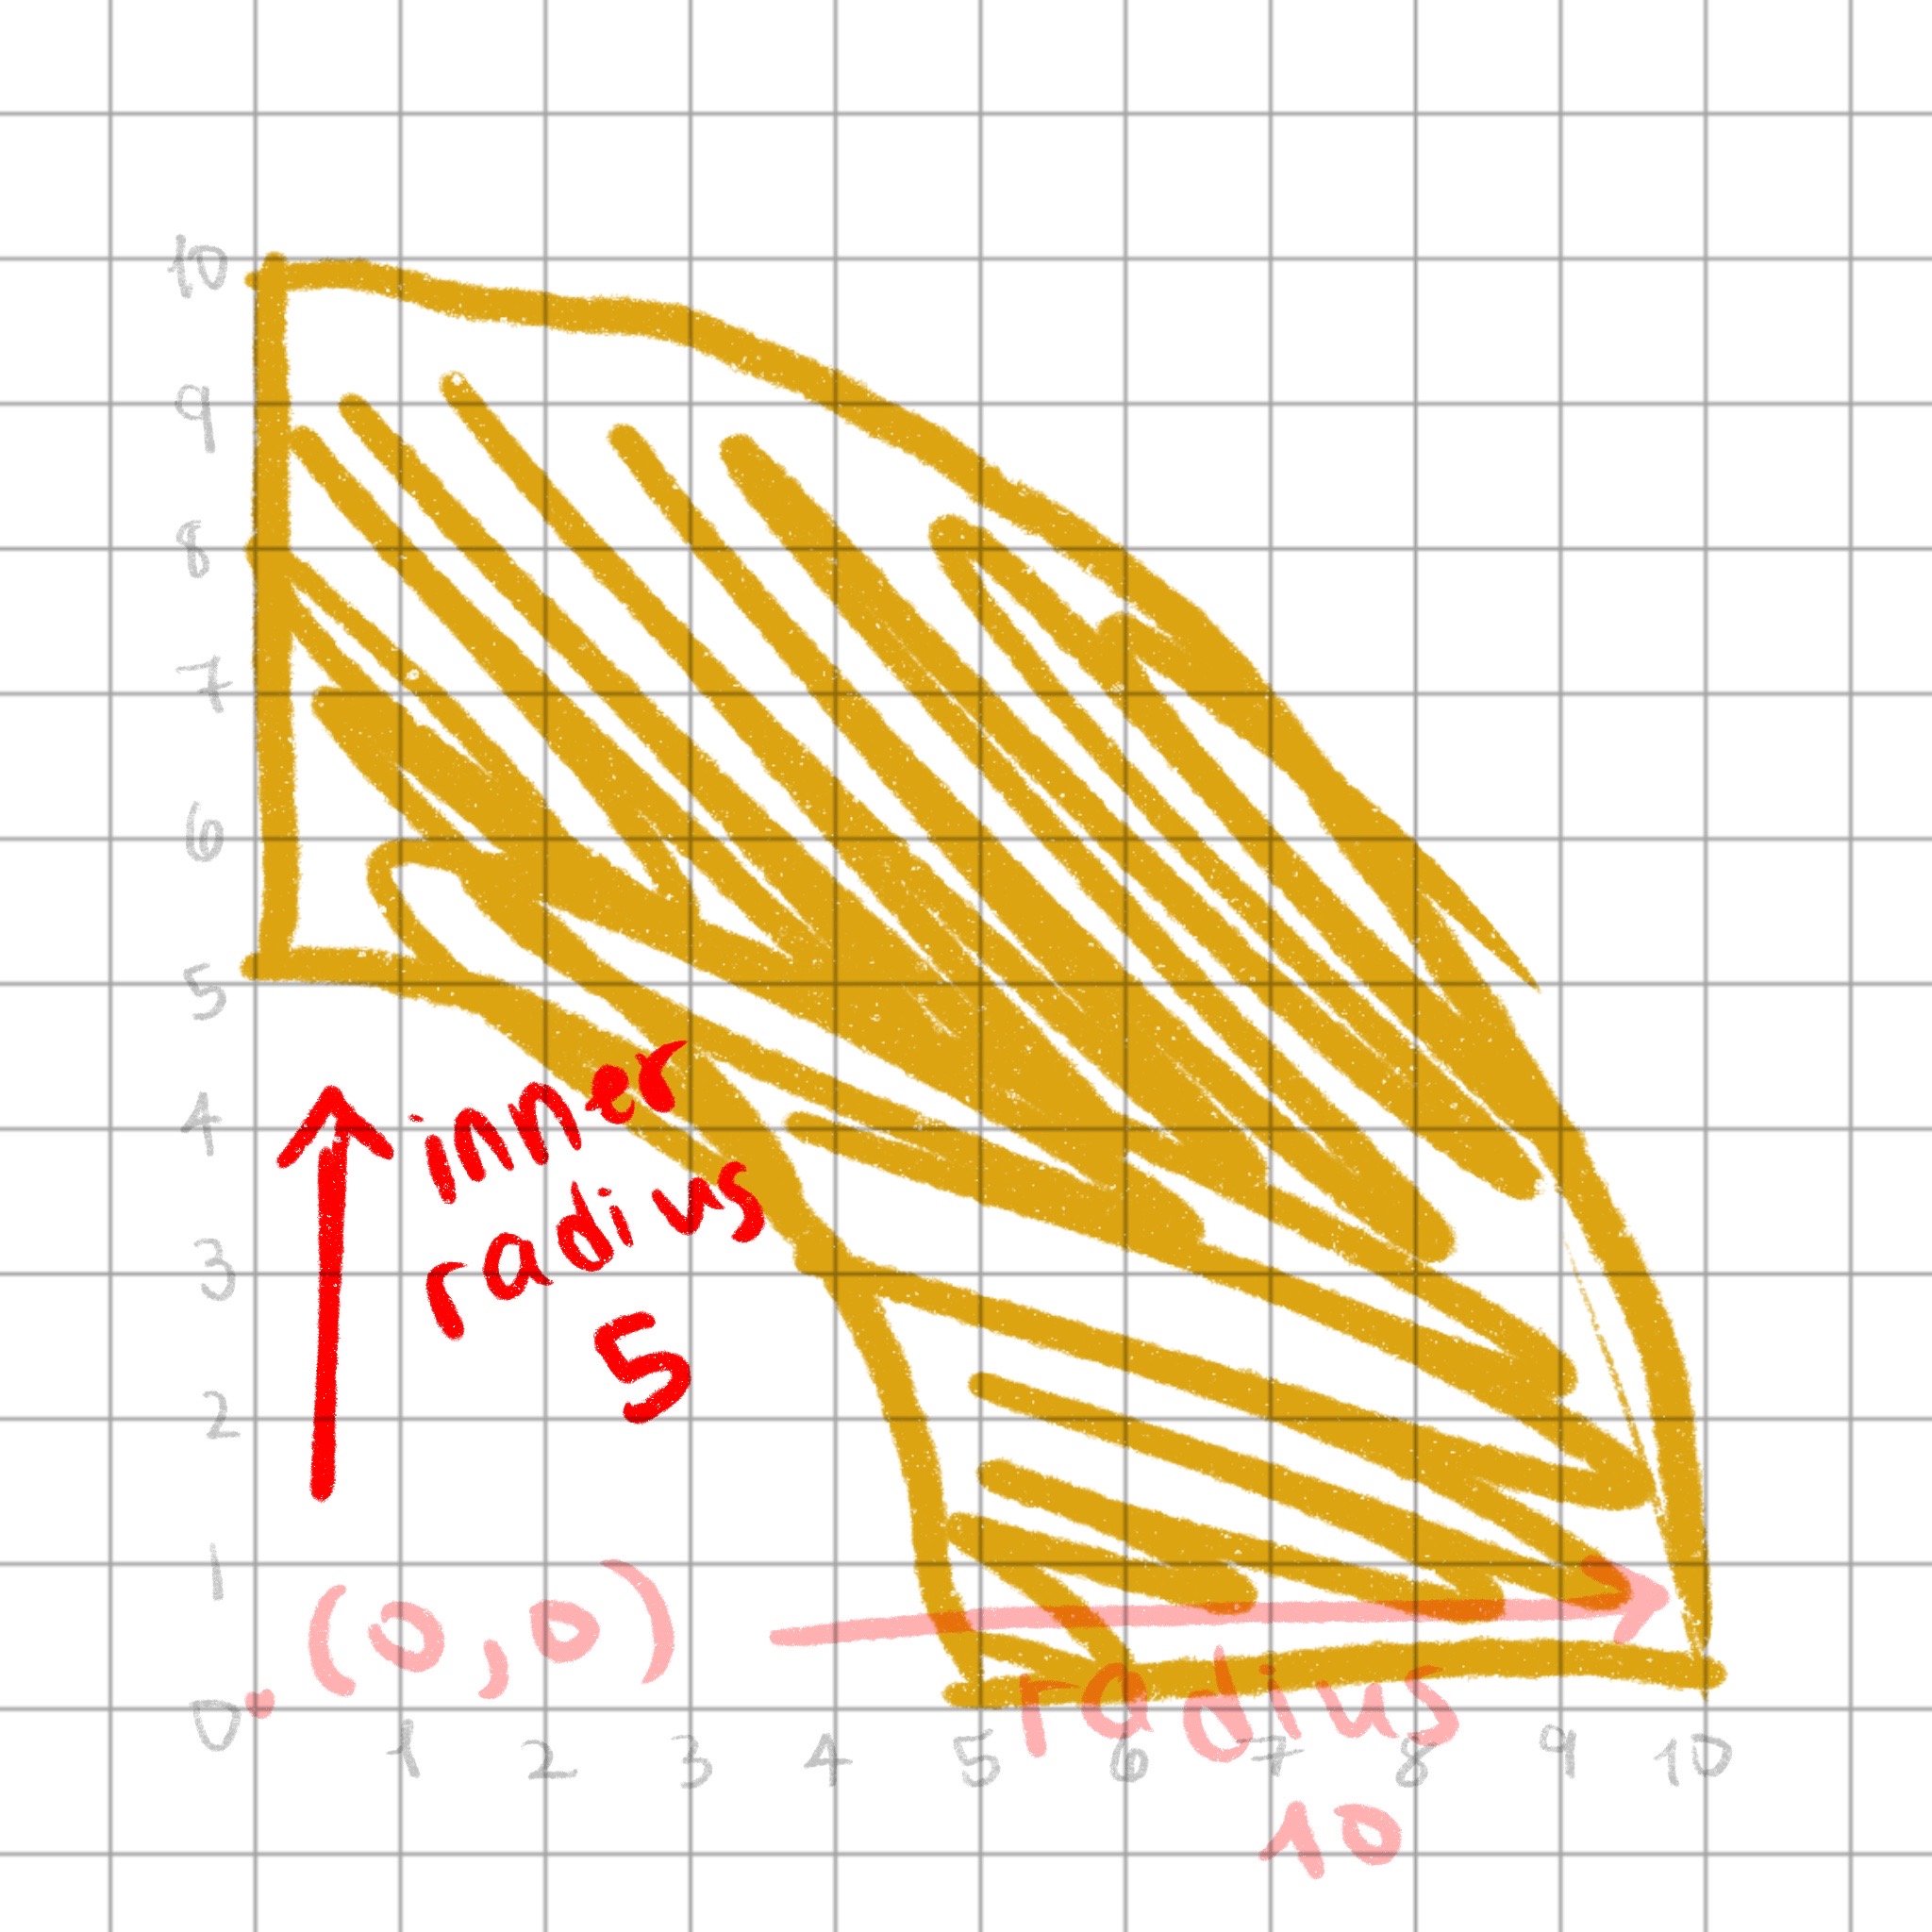
Quarter donut, quadrant 1

Quarter donut, quadrant 2
Quarter donut, quadrant 2

Quarter donut, quadrant 3
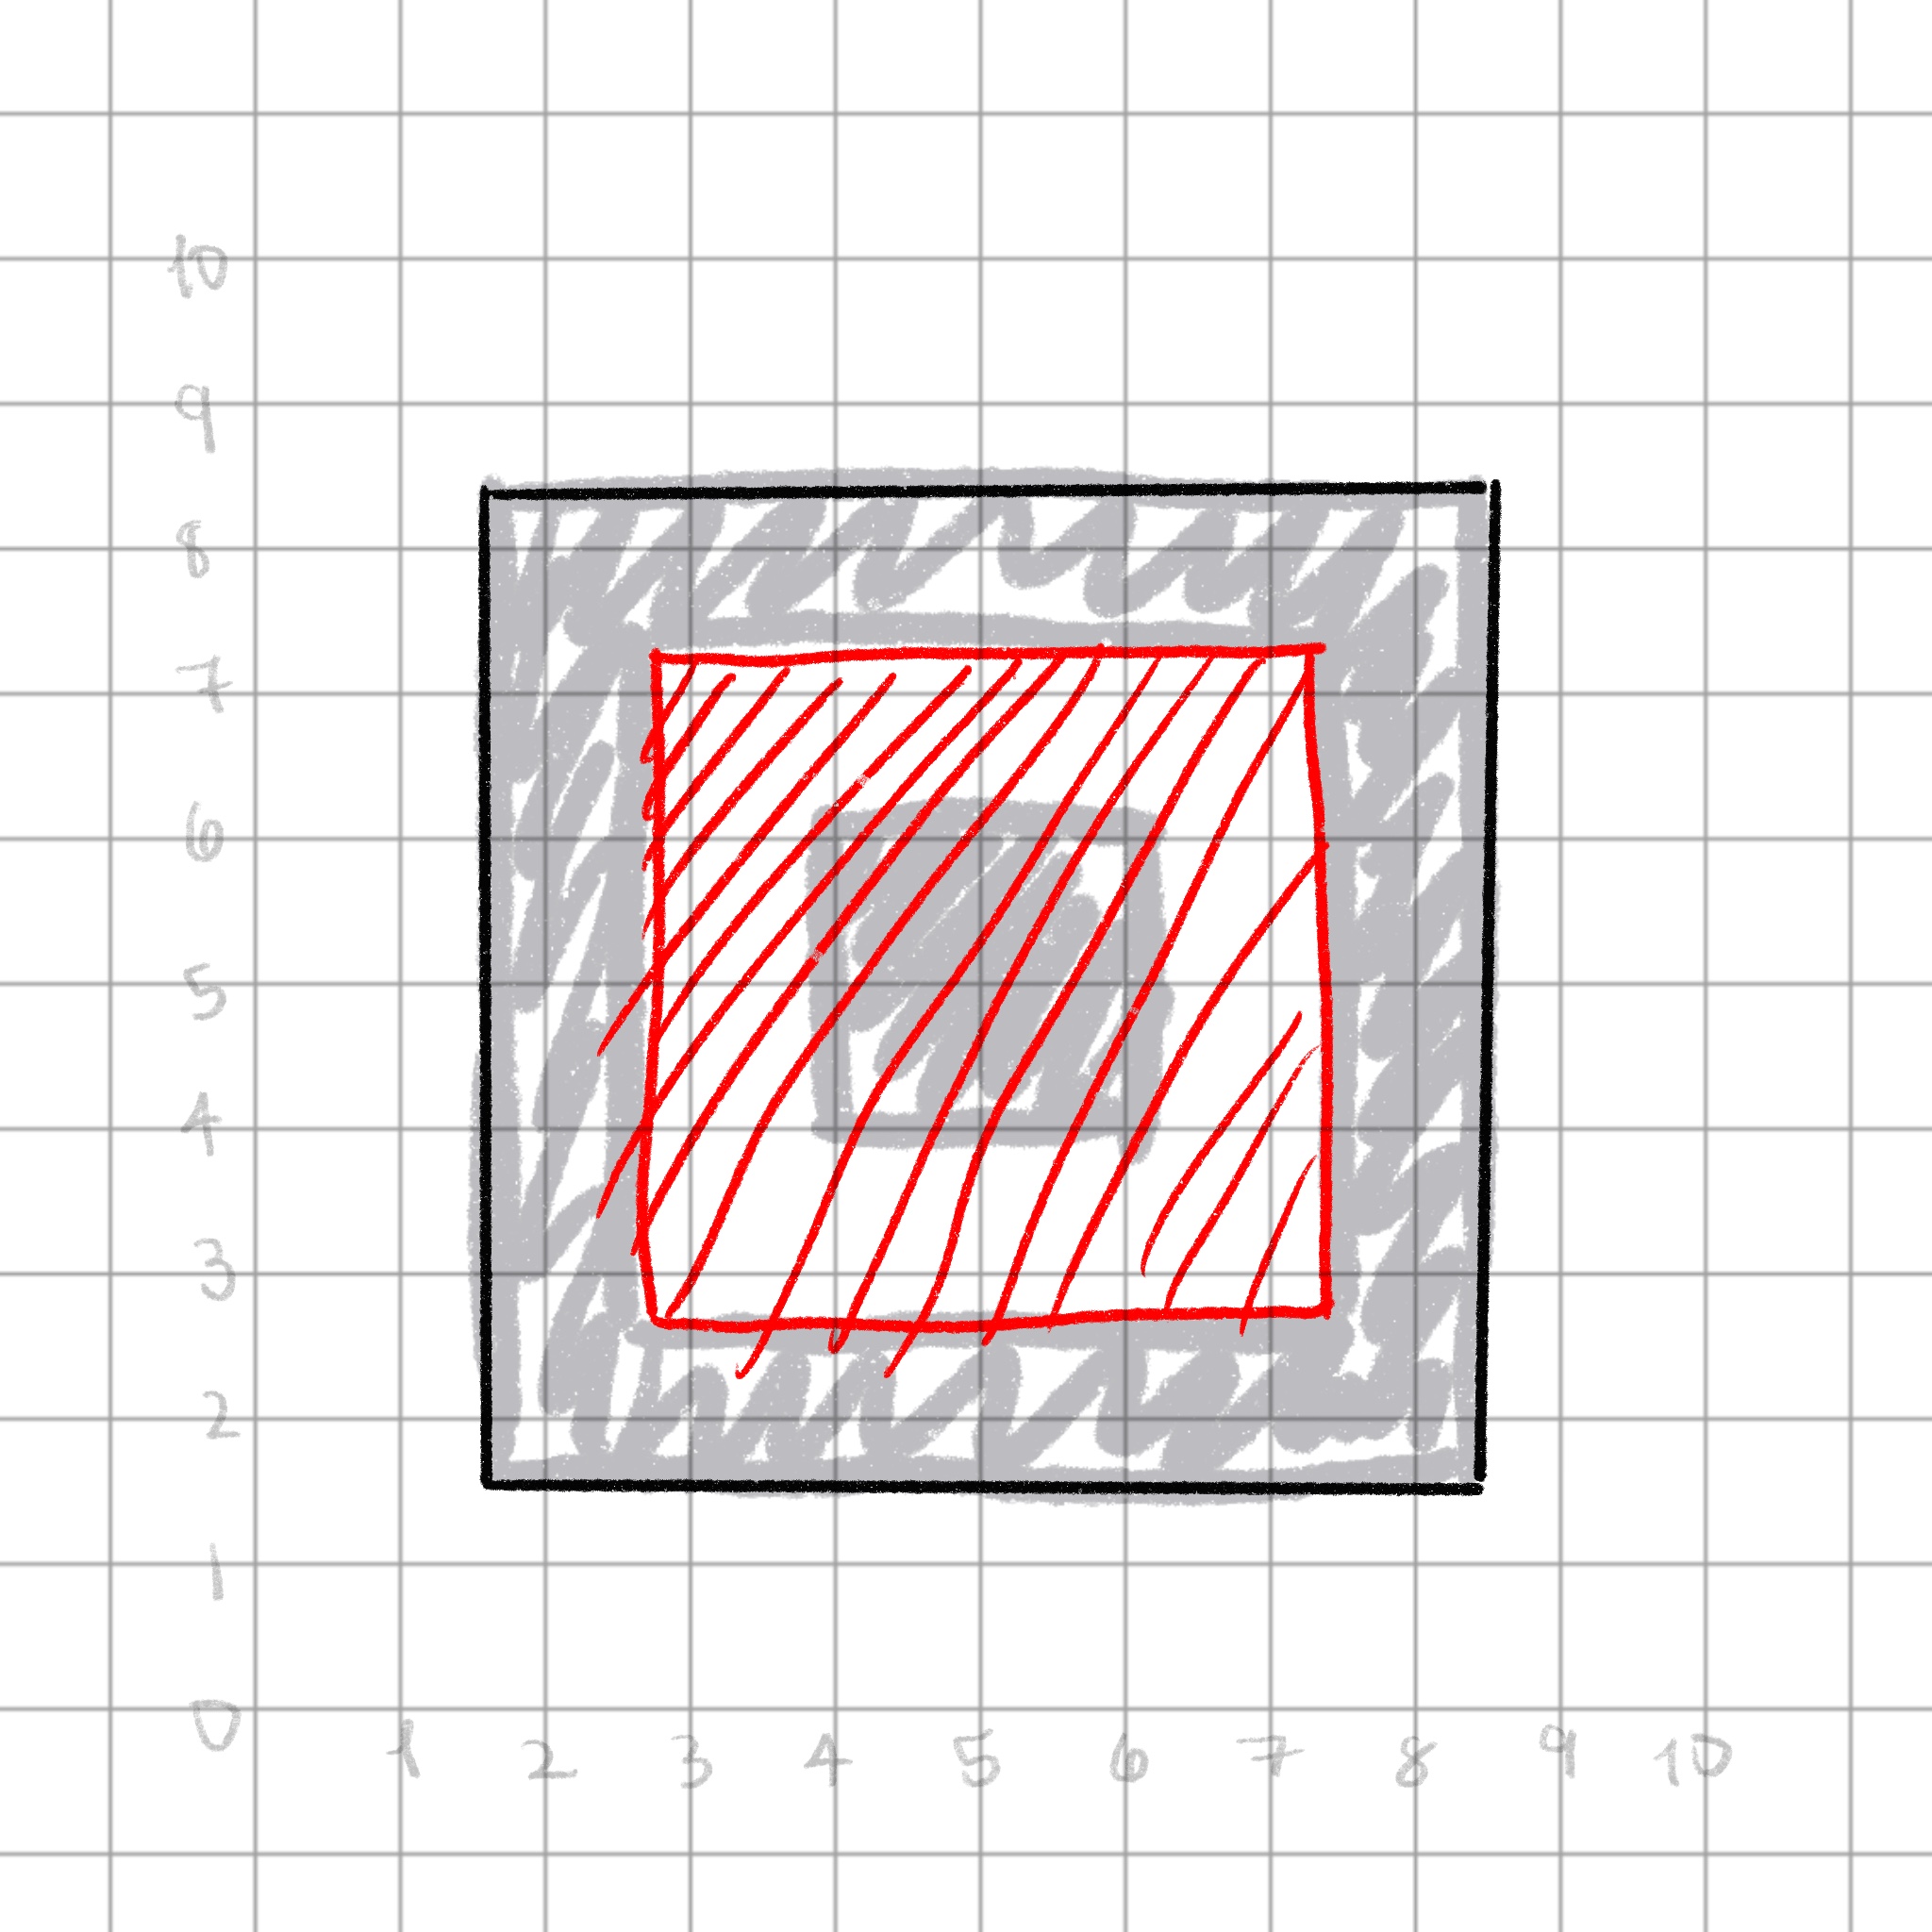
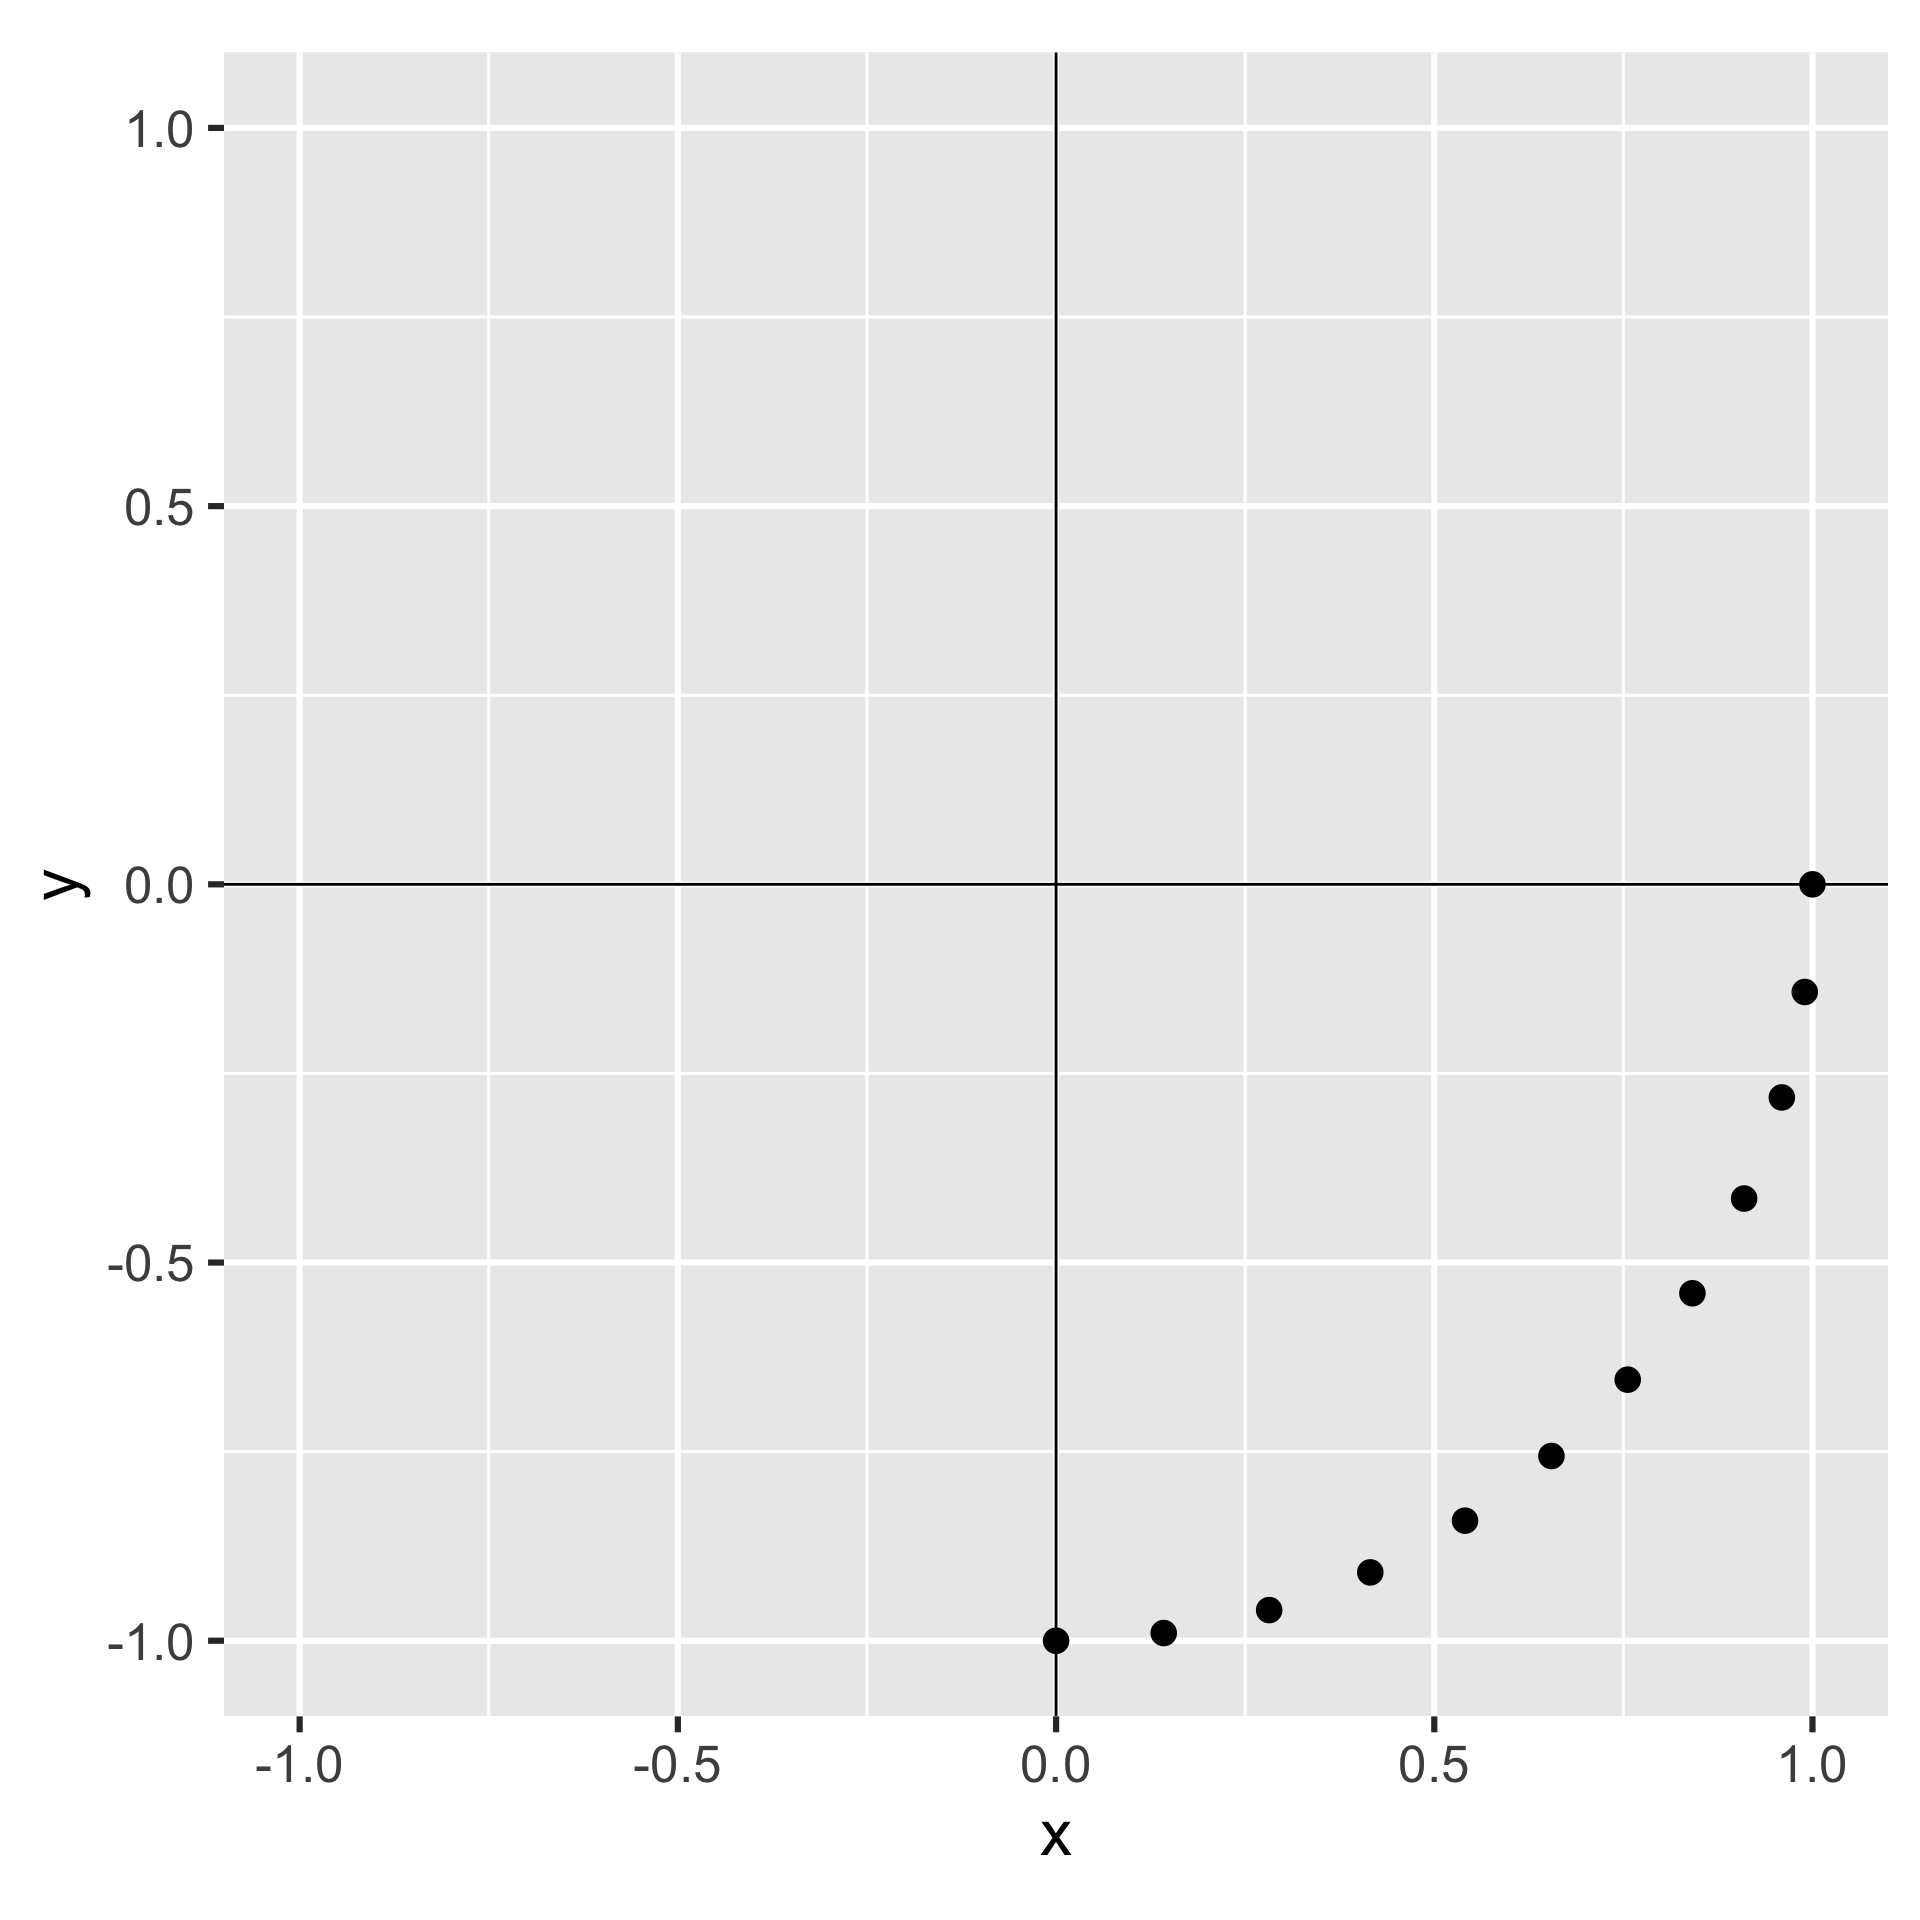
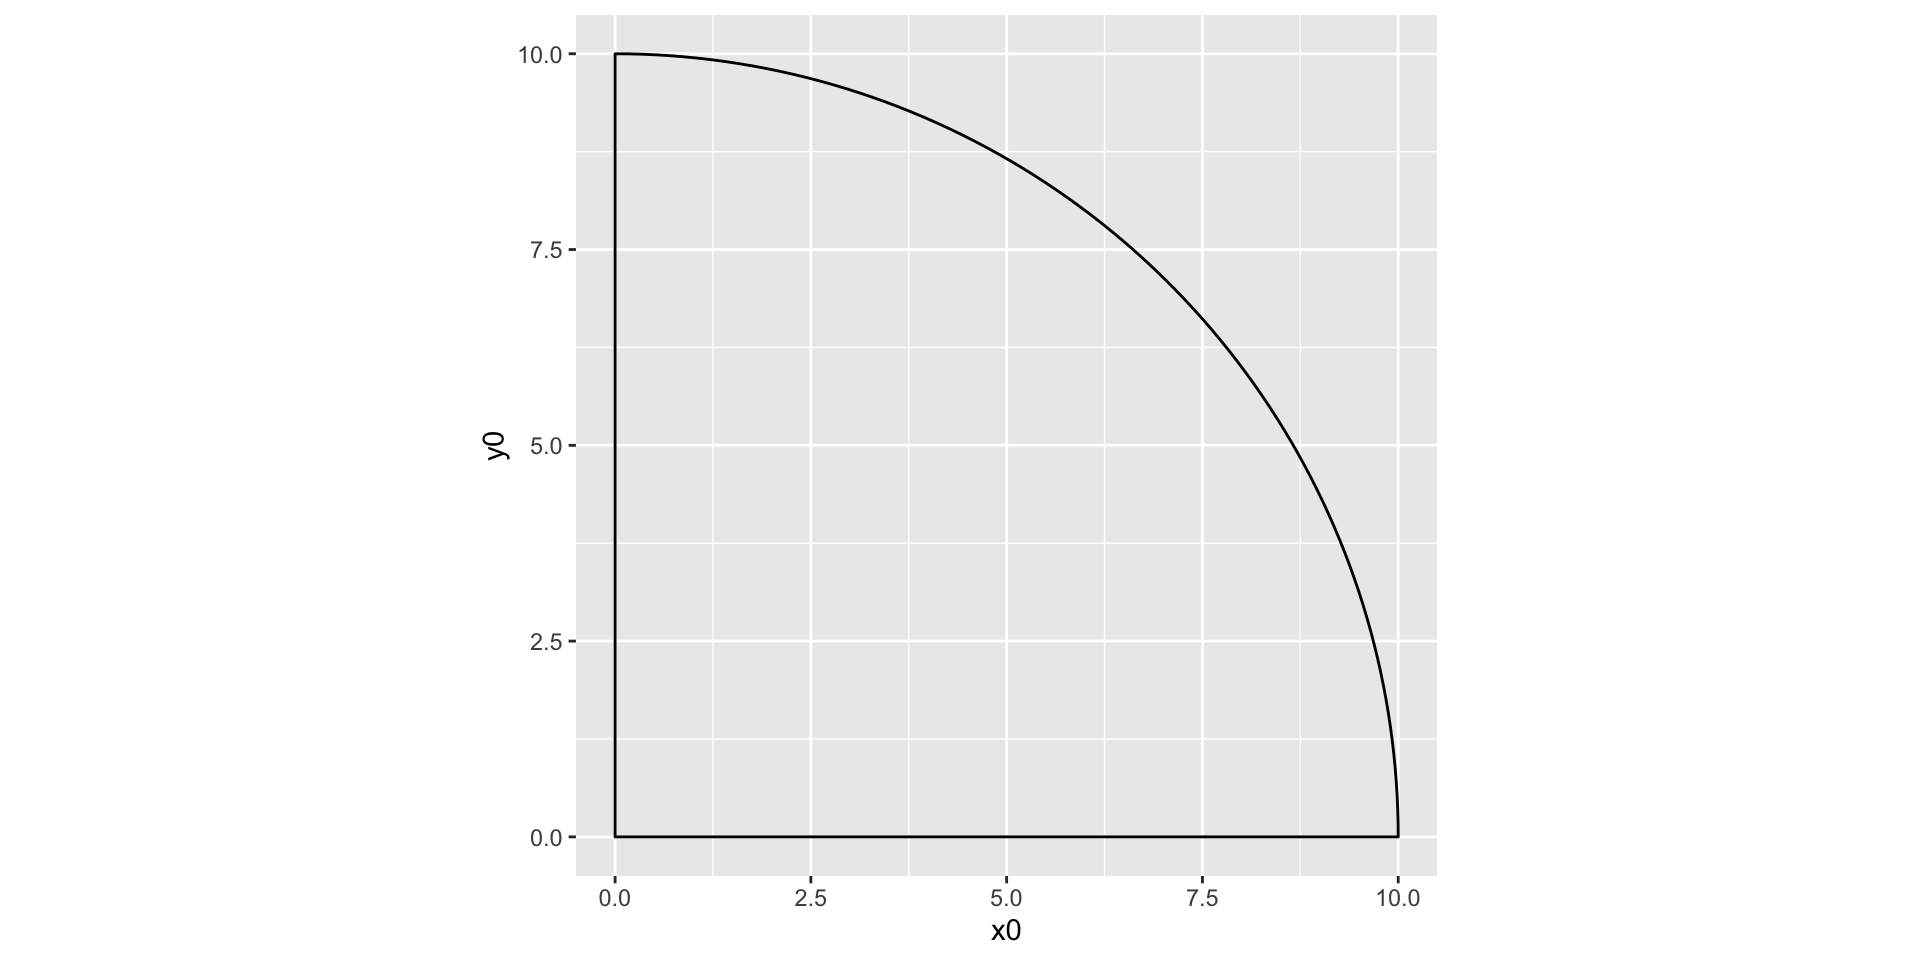
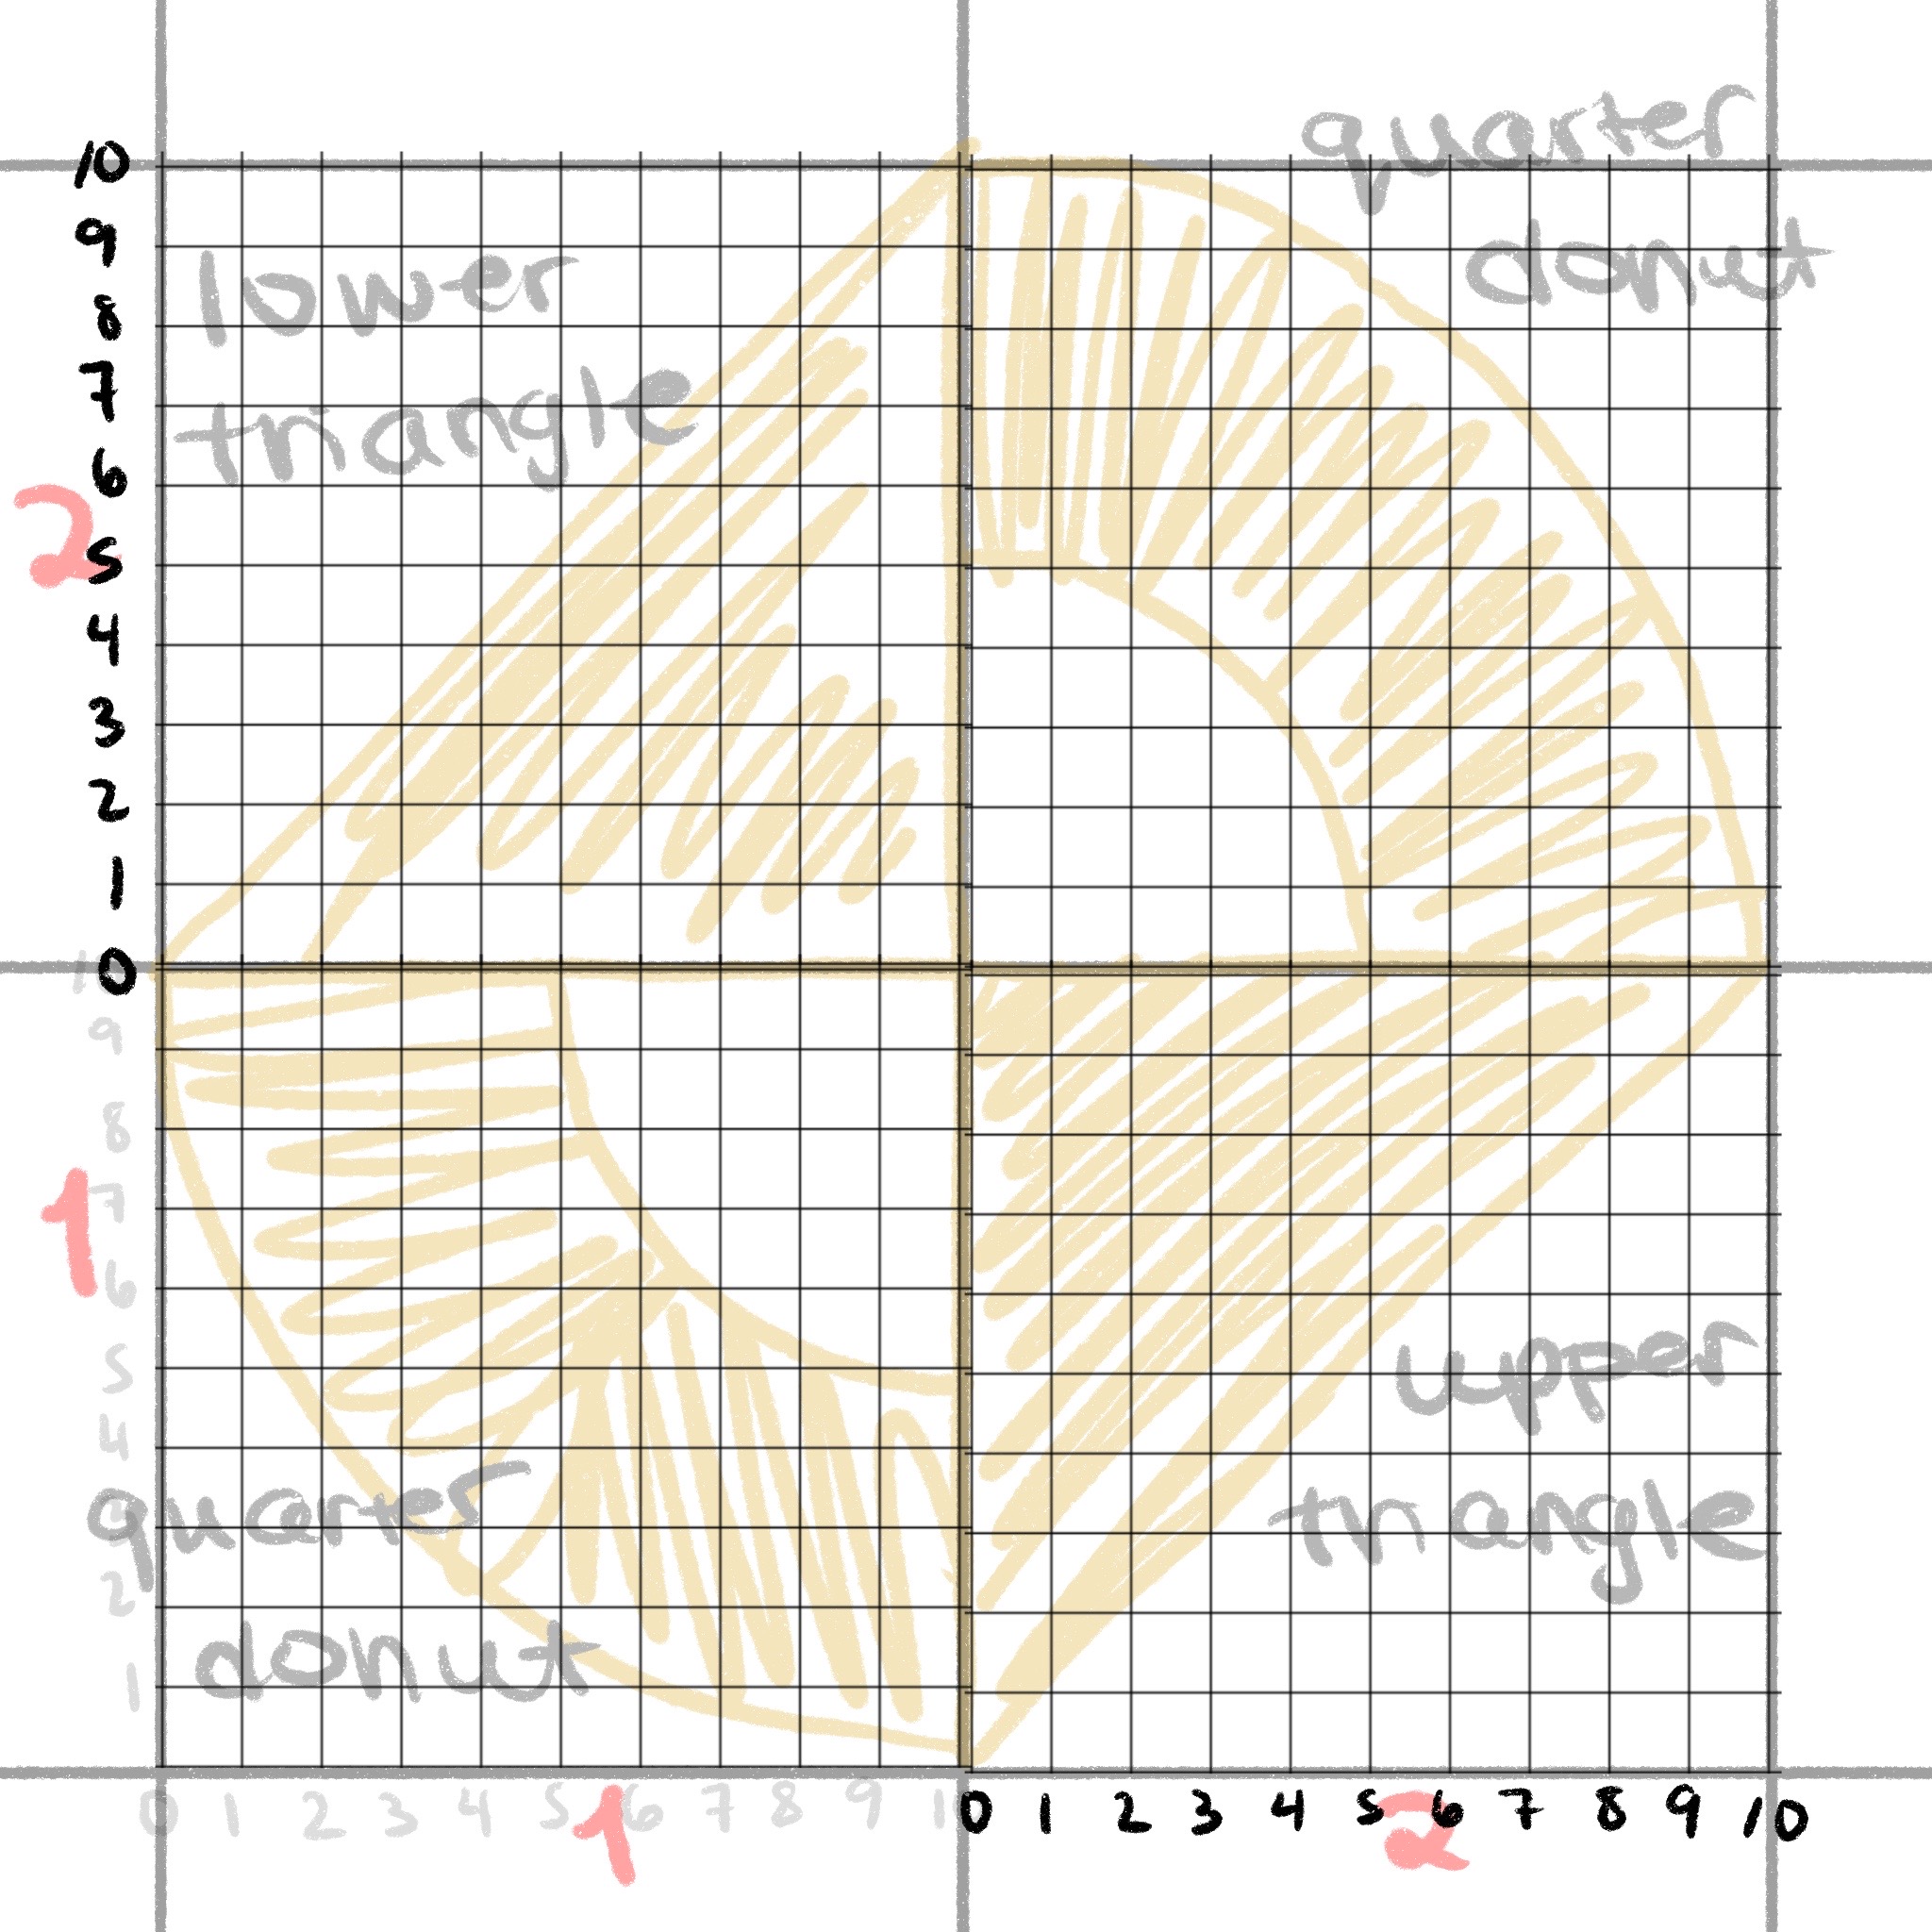
- Open the file file
exercises/02-riso-grids/exercise-1.Rmd - Determine the
x,y,start, andendof the bottom left circle, pictured here - Plot it using
geom_arc_bar()
05:00
Quarter donut, quadrant 4

Shape plotter
mapping: x = ~x, y = ~y, group = ~group, subgroup = ~subgroup, fill = ~color
geom_polygon: na.rm = FALSE, rule = evenodd
stat_identity: na.rm = FALSE
position_identity
Returns only the geom_*() function, which can be used directly in a ggplot2 pipeline, or with multiple together in a list()

Grid of shapes
layer_1 <- tribble(
  ~row, ~column,             ~shape,
     1,       1, "quarter donut q3",
     1,       2,   "upper triangle",
     2,       2, "quarter donut q1",
     2,       1,   "lower triangle"
  )  %>%
  mutate(
    color = yellow,
    id = row_number()
  )

layer_1
# A tibble: 4 × 5
row column shape color id
<dbl> <dbl> <chr> <chr> <int>
1 1 1 quarter donut q3 #DDA710 1
2 1 2 upper triangle #DDA710 2
3 2 2 quarter donut q1 #DDA710 3
4 2 1 lower triangle #DDA710 4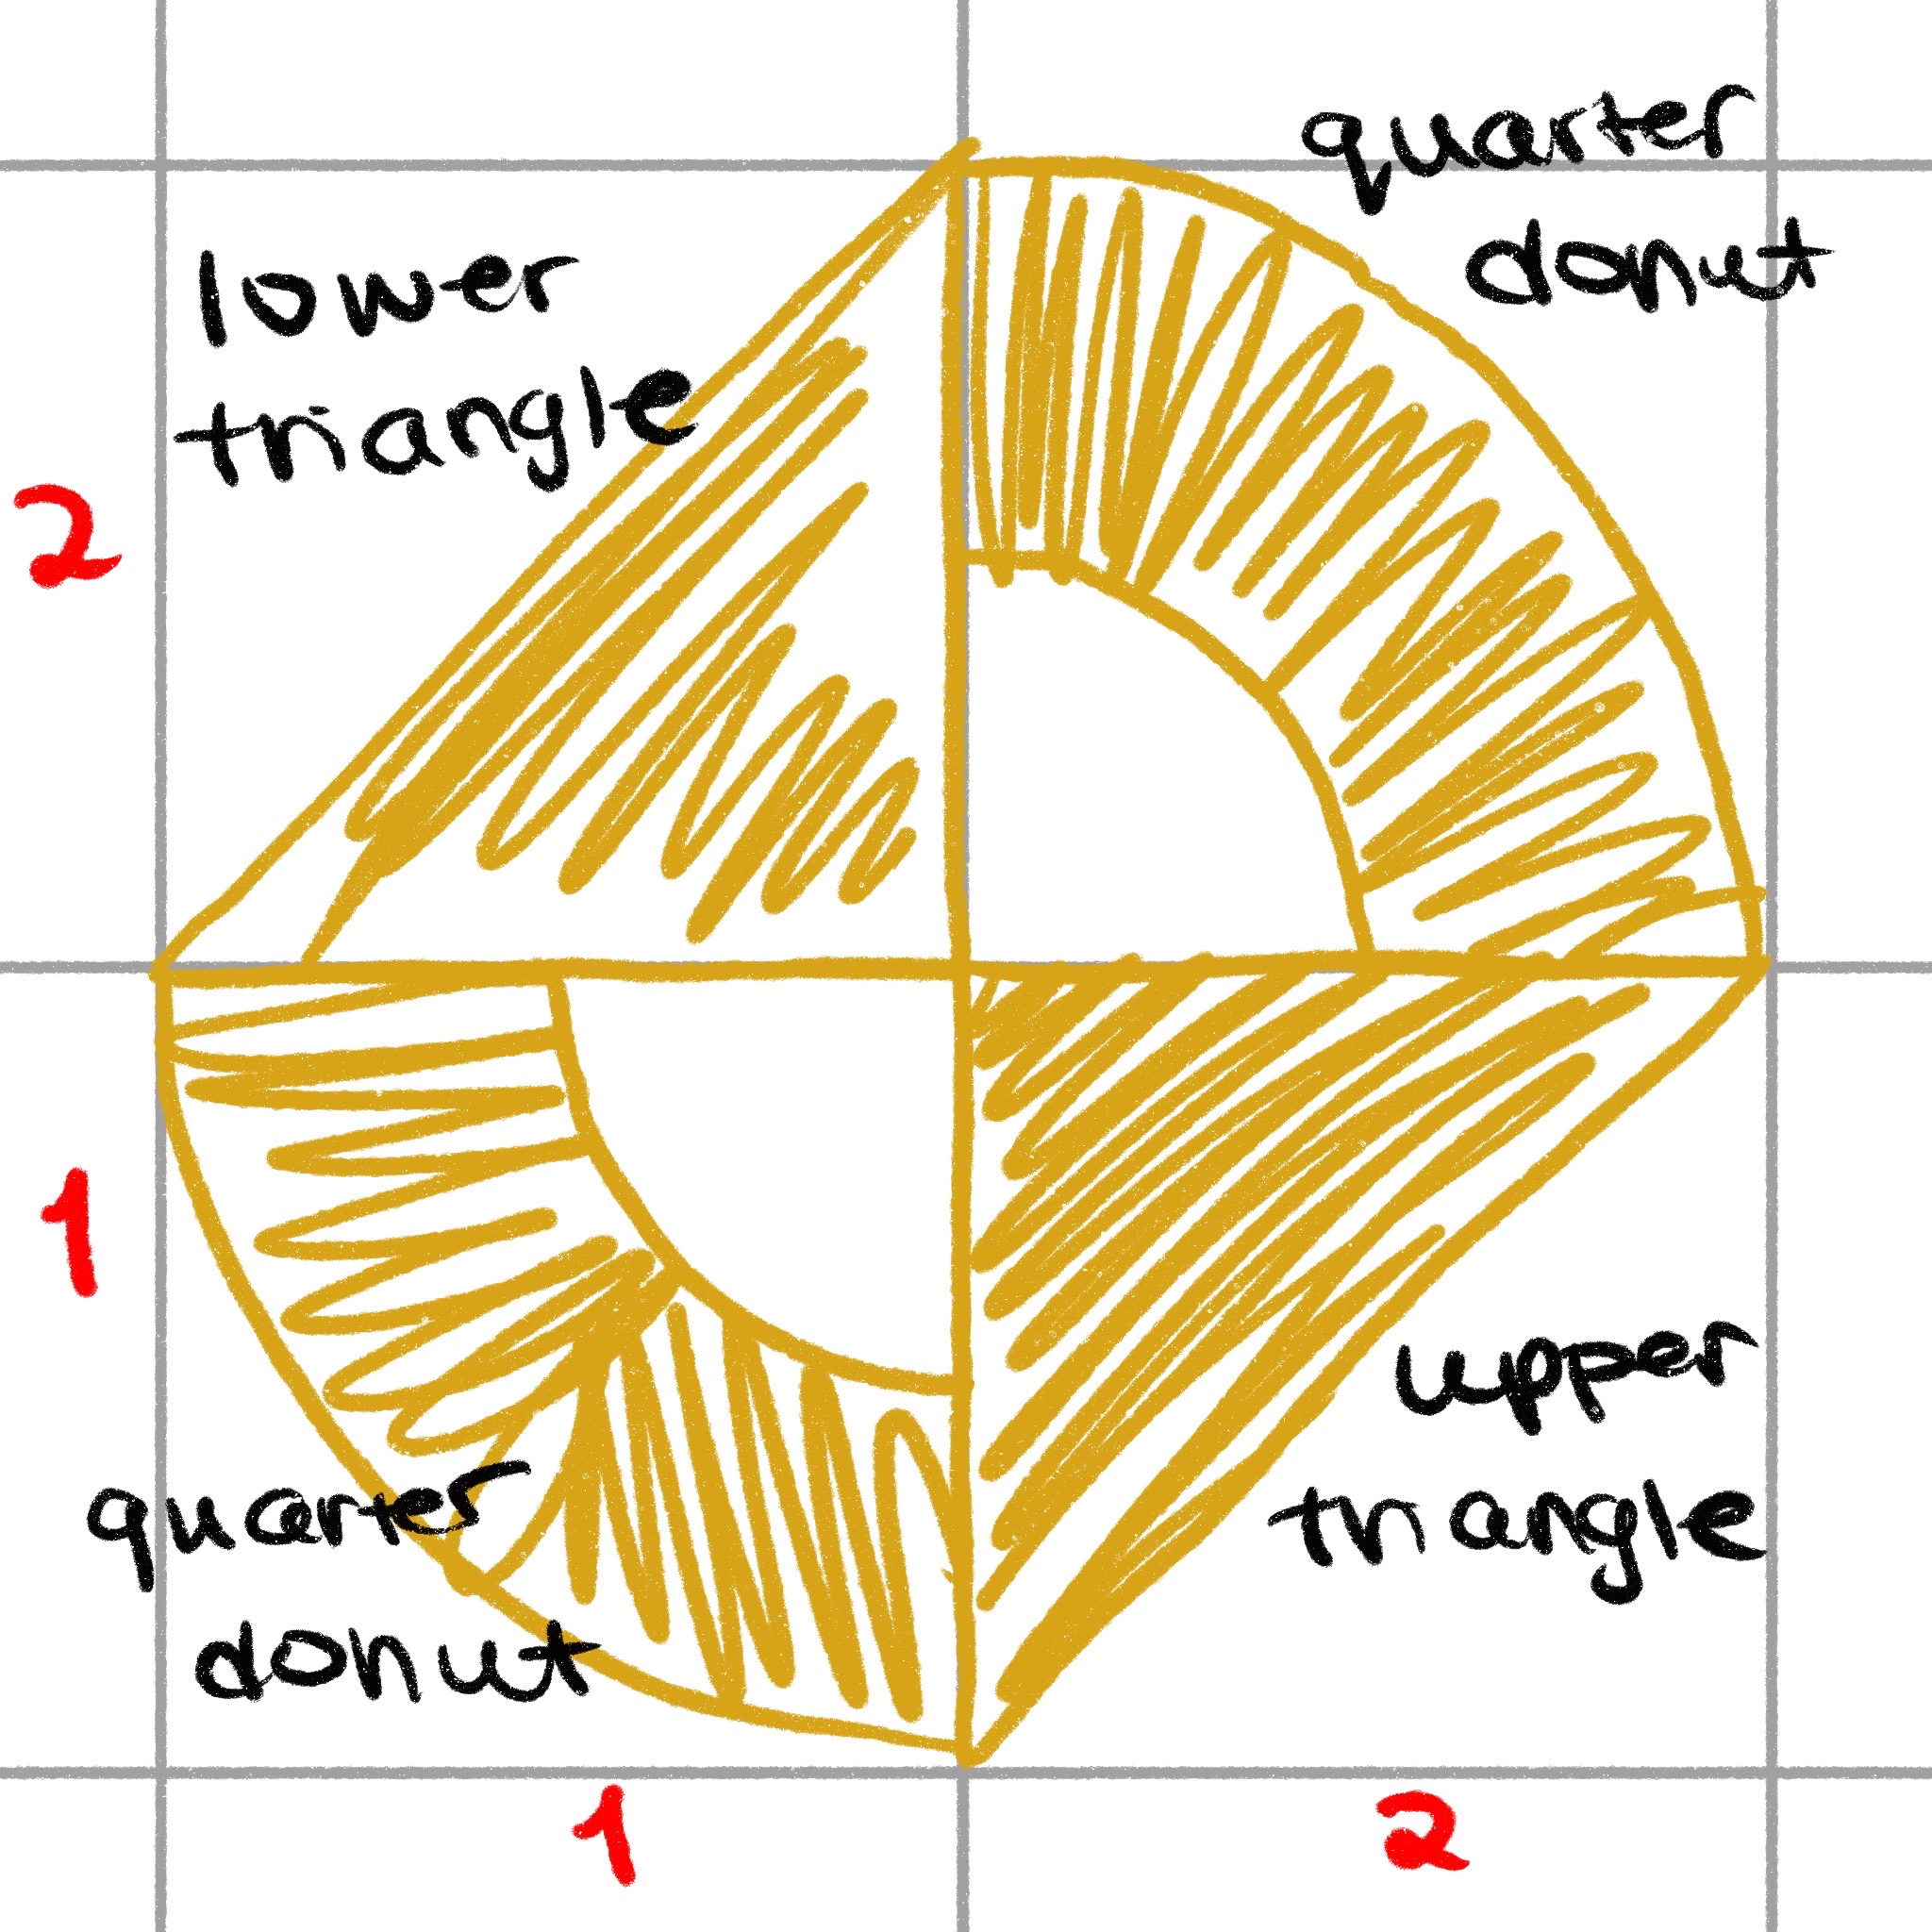
Create the grid of shapes
$`1`
# A tibble: 1 × 5
    row column shape            color      id
  <dbl>  <dbl> <chr>            <chr>   <int>
1     1      1 quarter donut q3 #DDA710     1

$`2`
# A tibble: 1 × 5
    row column shape          color      id
  <dbl>  <dbl> <chr>          <chr>   <int>
1     1      2 upper triangle #DDA710     2

$`3`
# A tibble: 1 × 5
    row column shape            color      id
  <dbl>  <dbl> <chr>            <chr>   <int>
1     2      2 quarter donut q1 #DDA710     3

$`4`
# A tibble: 1 × 5
    row column shape          color      id
  <dbl>  <dbl> <chr>          <chr>   <int>
1     2      1 lower triangle #DDA710     4
List of plotters
library(purrr)

layer_1_plotting <- layer_1 %>%
  split(.$id) %>%
  map(function(data) {
    generate_shape_data(data[["shape"]], data[["color"]])
  }) %>%
  map(function(data) {
    data %>%
      generate_shape_plotter()
  })

layer_1_plotting
$`1`
mapping: x0 = ~x, y0 = ~y, r = ~r, r0 = ~r0, start = ~start, end = ~end, fill = ~color
geom_arc_bar: expand = 0, radius = 0
stat_arc_bar: na.rm = FALSE, n = 360
position_identity
$`2`
mapping: x = ~x, y = ~y, group = ~group, subgroup = ~subgroup, fill = ~color
geom_polygon: na.rm = FALSE, rule = evenodd
stat_identity: na.rm = FALSE
position_identity
$`3`
mapping: x0 = ~x, y0 = ~y, r = ~r, r0 = ~r0, start = ~start, end = ~end, fill = ~color
geom_arc_bar: expand = 0, radius = 0
stat_arc_bar: na.rm = FALSE, n = 360
position_identity
$`4`
mapping: x = ~x, y = ~y, group = ~group, subgroup = ~subgroup, fill = ~color
geom_polygon: na.rm = FALSE, rule = evenodd
stat_identity: na.rm = FALSE
position_identity 
Using a list of plotters together

???
Shifting data
Shifting data
Now plot!

Do the same for the second layer!
layer_2 <- tribble(
  ~row, ~column,             ~shape,
     1,       1,      "oreo square",
     1,       2, "quarter donut q2",
     2,       2,      "oreo square",
     2,       1, "quarter donut q4"
  ) %>%
  mutate(
    color = grey,
    id = row_number()
  )

layer_2_plotting <- layer_2 %>%
  split(.$id) %>%
  map_dfr(
    function(data) {
      generate_shape_data(data[["shape"]], data[["color"]])
    },
    .id = "id"
  ) %>%
  mutate(id = as.numeric(id)) %>%
  left_join(layer_2, by = c("id", "color", "shape")) %>%
  mutate(
    x = x + column * grid_size,
    y = y + row * grid_size
  ) %>%
  split(.$id) %>%
  map(function(data) {
    generate_shape_plotter(data)
  })

ggplot() +
  layer_2_plotting +
  scale_fill_identity() +
  coord_fixed() +
  theme_void()
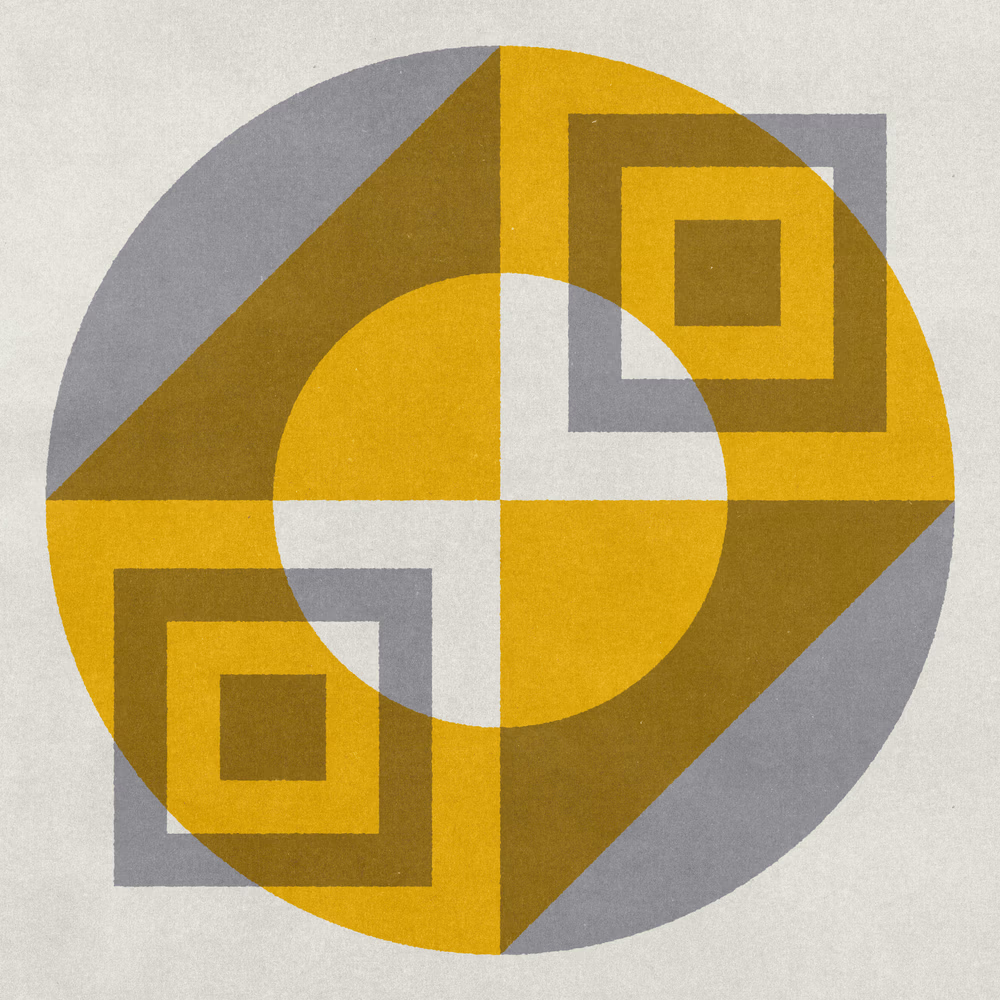
Put them together

Risograph effect please?
Risograph effect please?


Risograph effect please?

Risograph effect please?

Risograph effect please?
library(magick)

layer_1_img <- image_read(layer_1_file)
layer_2_img <- image_read(layer_2_file)

paper <- image_blank(
  width = image_info(layer_1_img)[["width"]],
  height = image_info(layer_1_img)[["height"]],
  color = "#E1DED7"
)

paper %>%
image_composite(layer_1_img) %>%
image_composite(
layer_2_img,
operator = "multiply"
)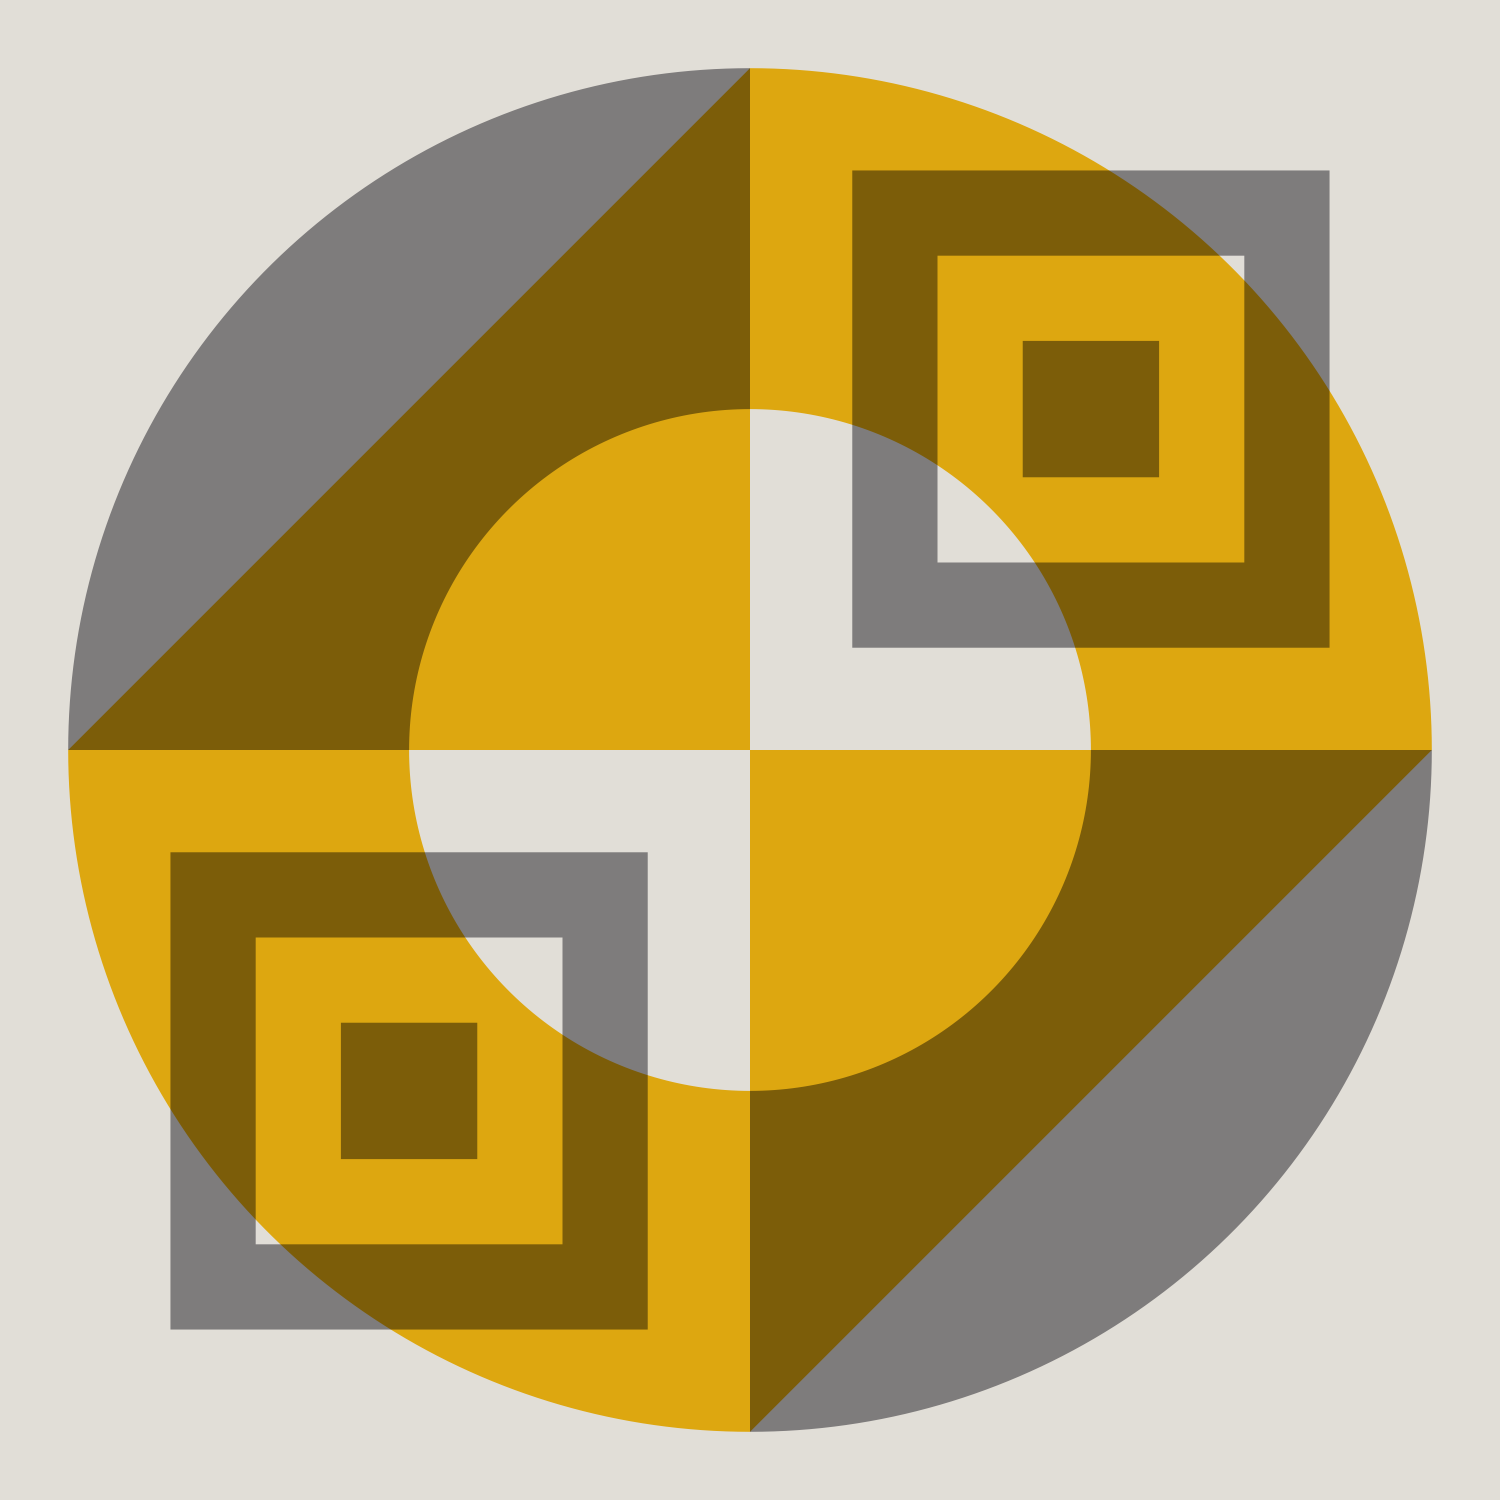
That’s not so bad!