Steal like an Rtist: Creative Coding in R
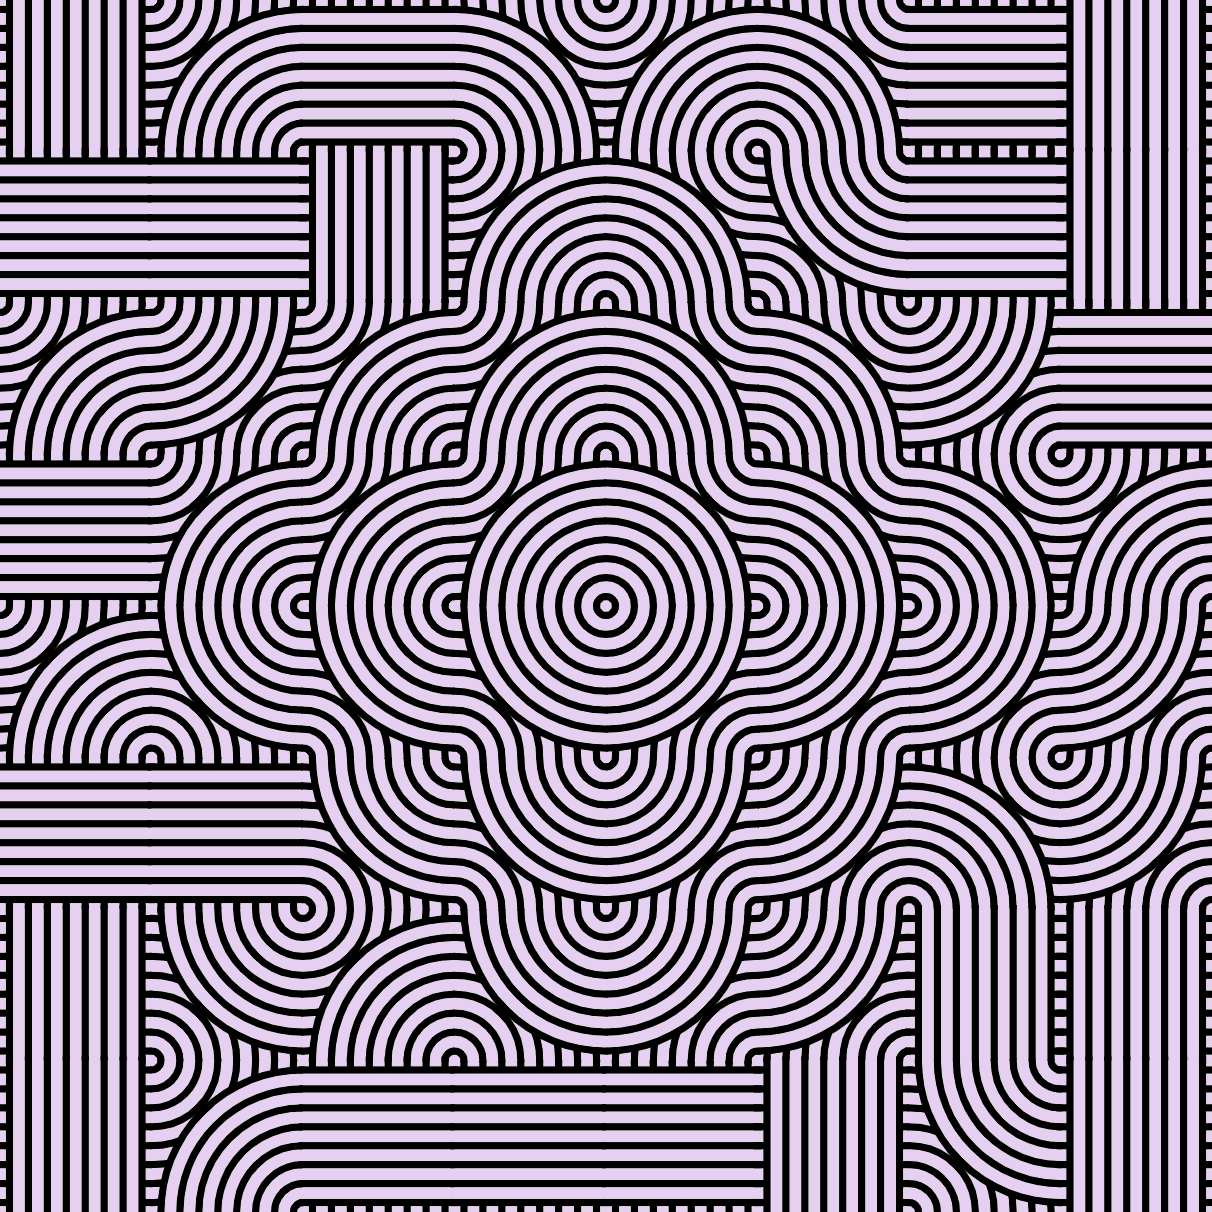
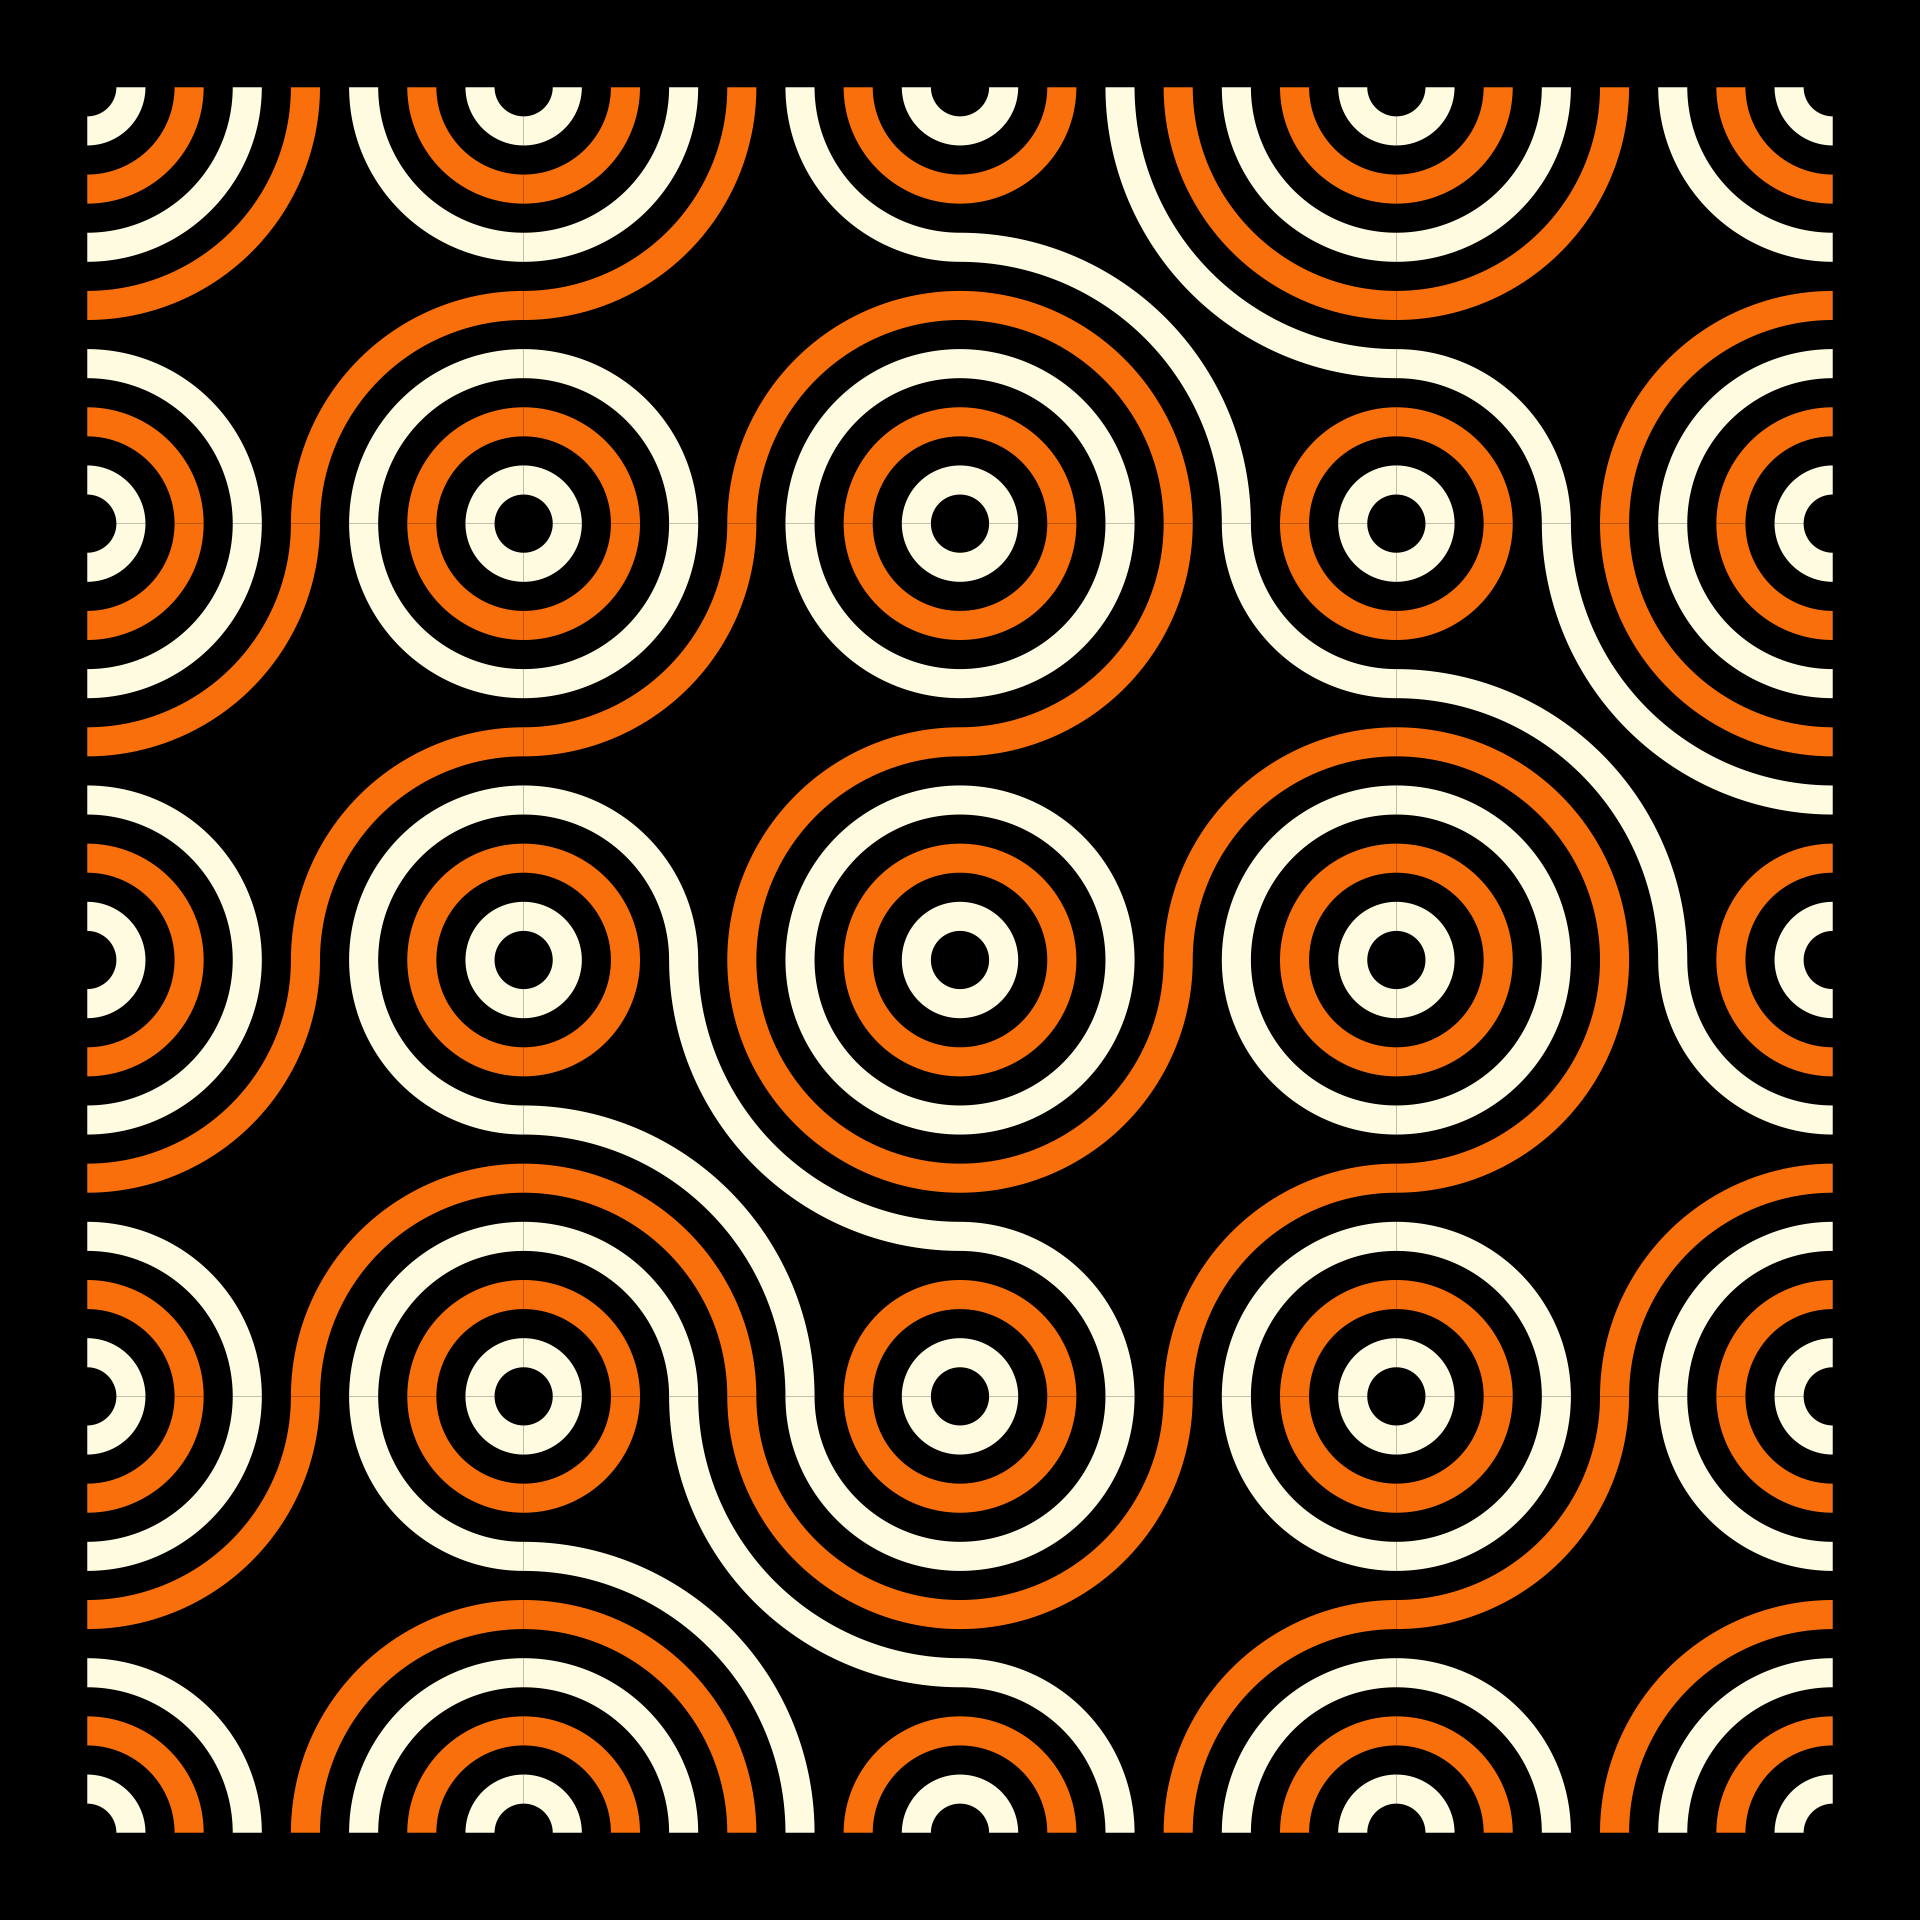
Infinite Truchet
Roni Kaufman
Infinite Truchet by Roni Kaufman
- Roni Kaufman is a self-described, creative coder and generative artist
- He regularly shares the code to his projects on openprocessing.org. This sketch is available at Open Processing
- Released under a CC BY-NC-SA 3.0 license (share and remix with attribution for noncommercial purposes)
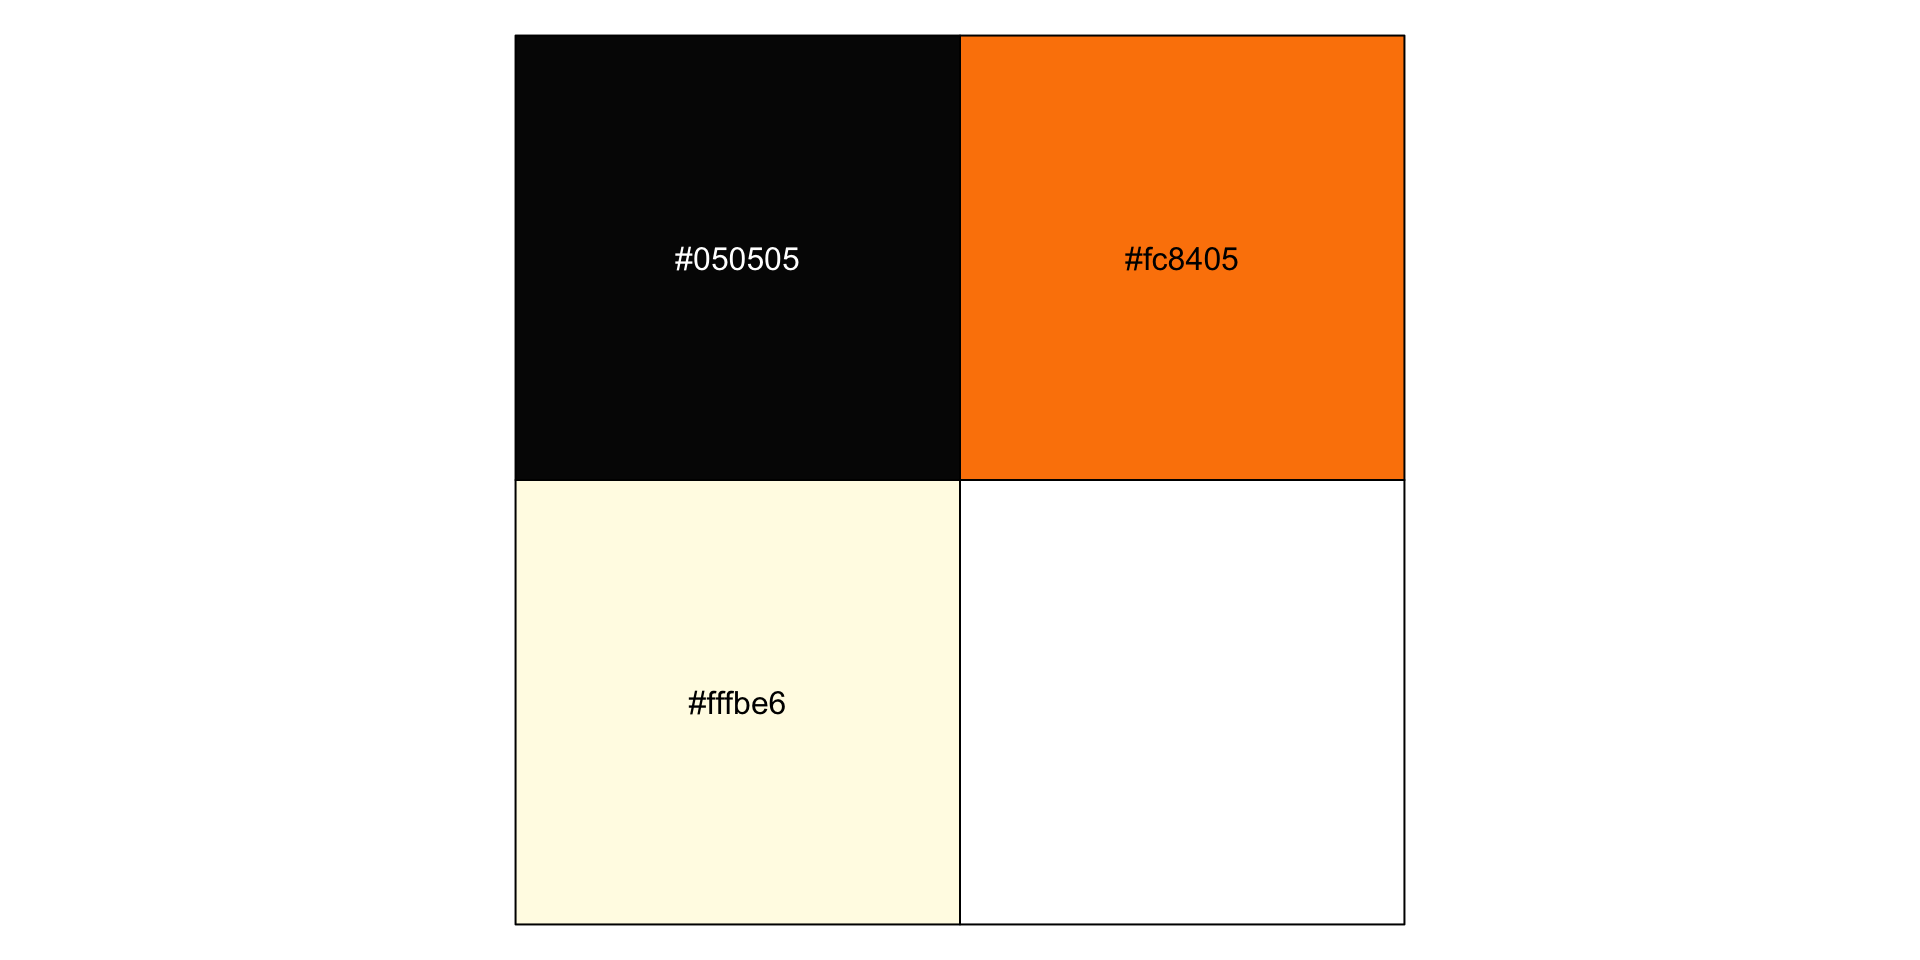
Infinite Truchet: Color palette
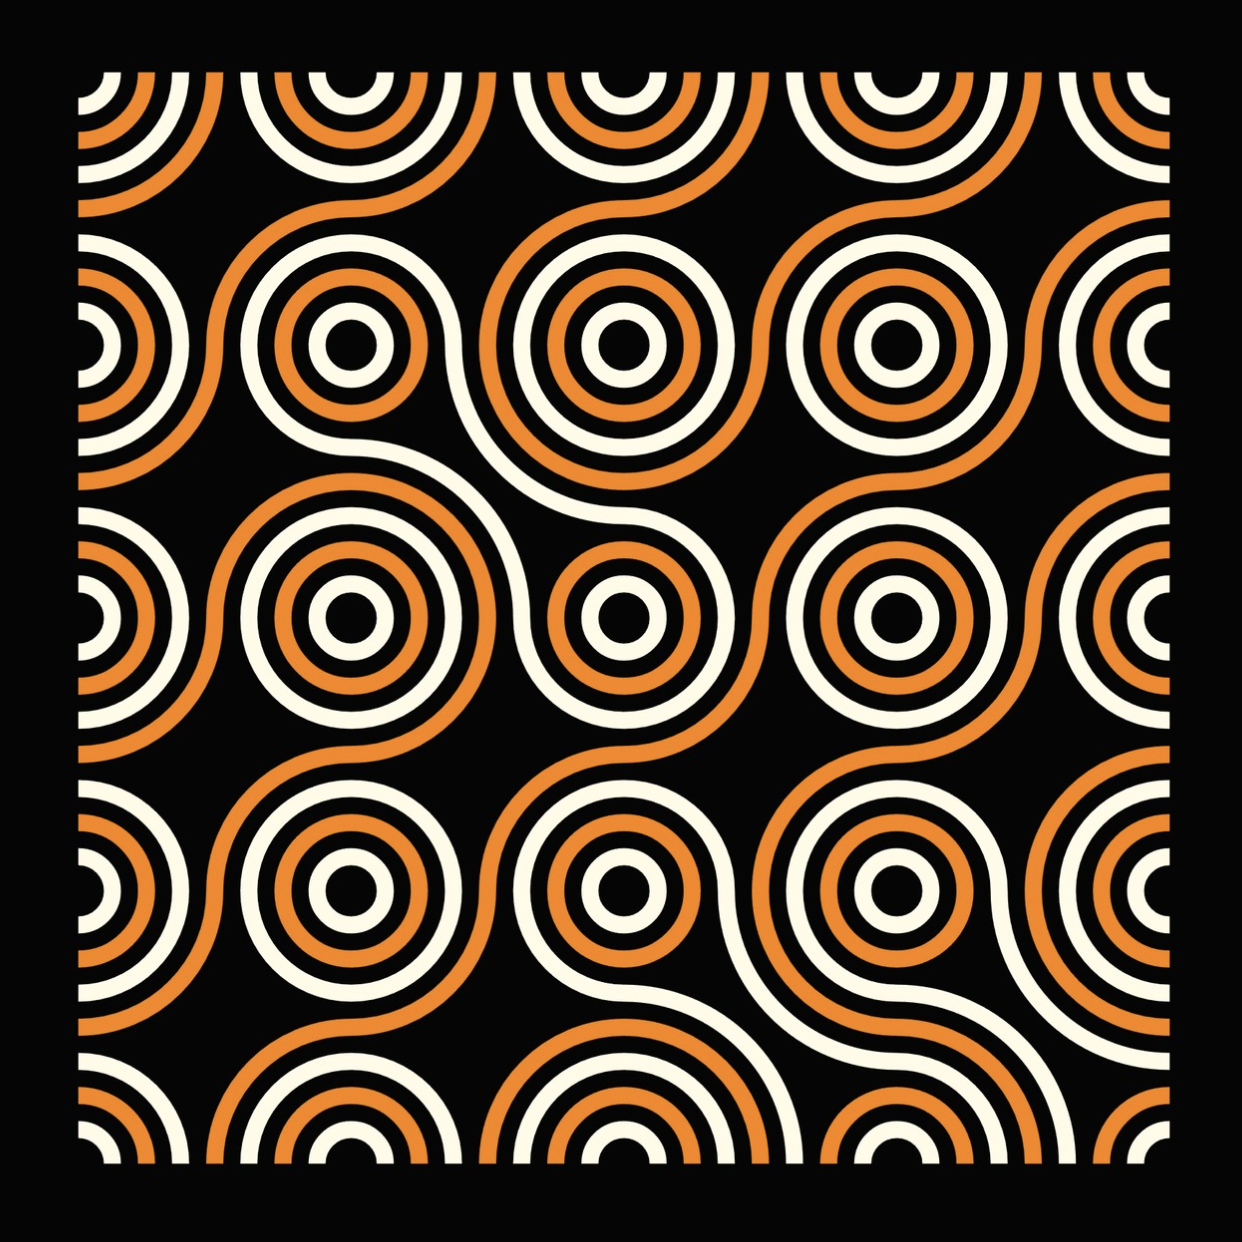
Infinite Truchet: Composition
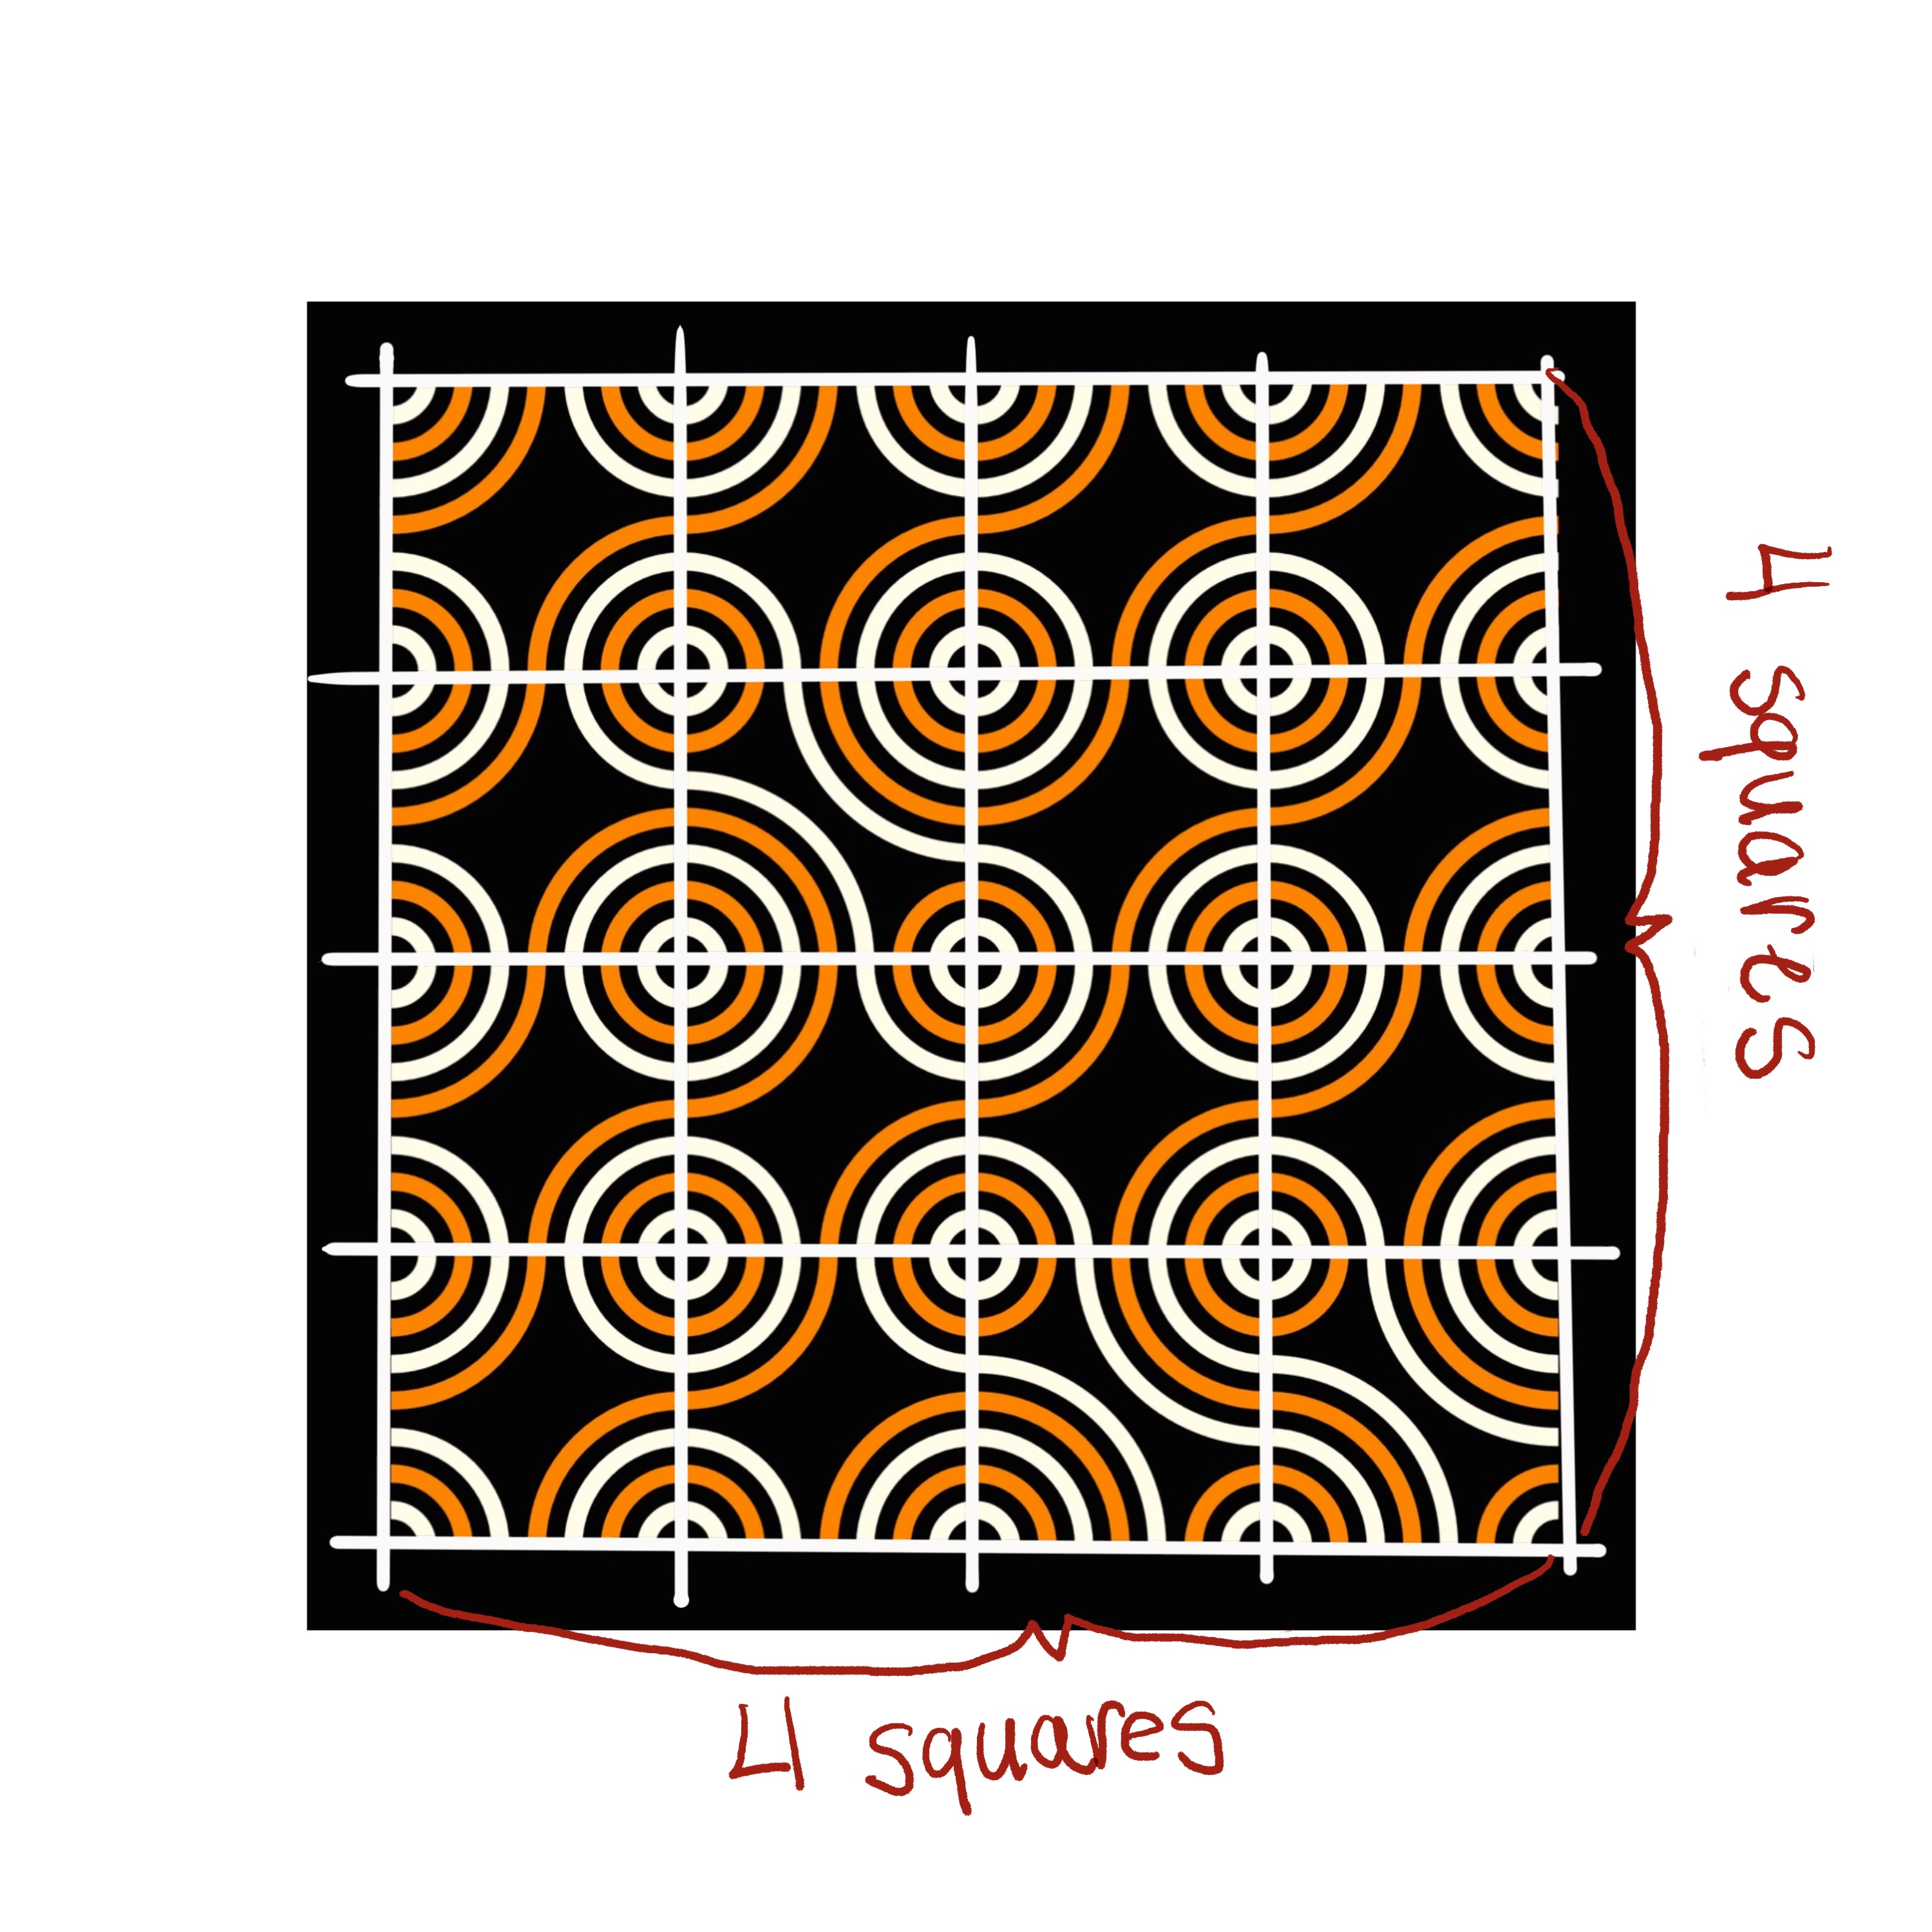
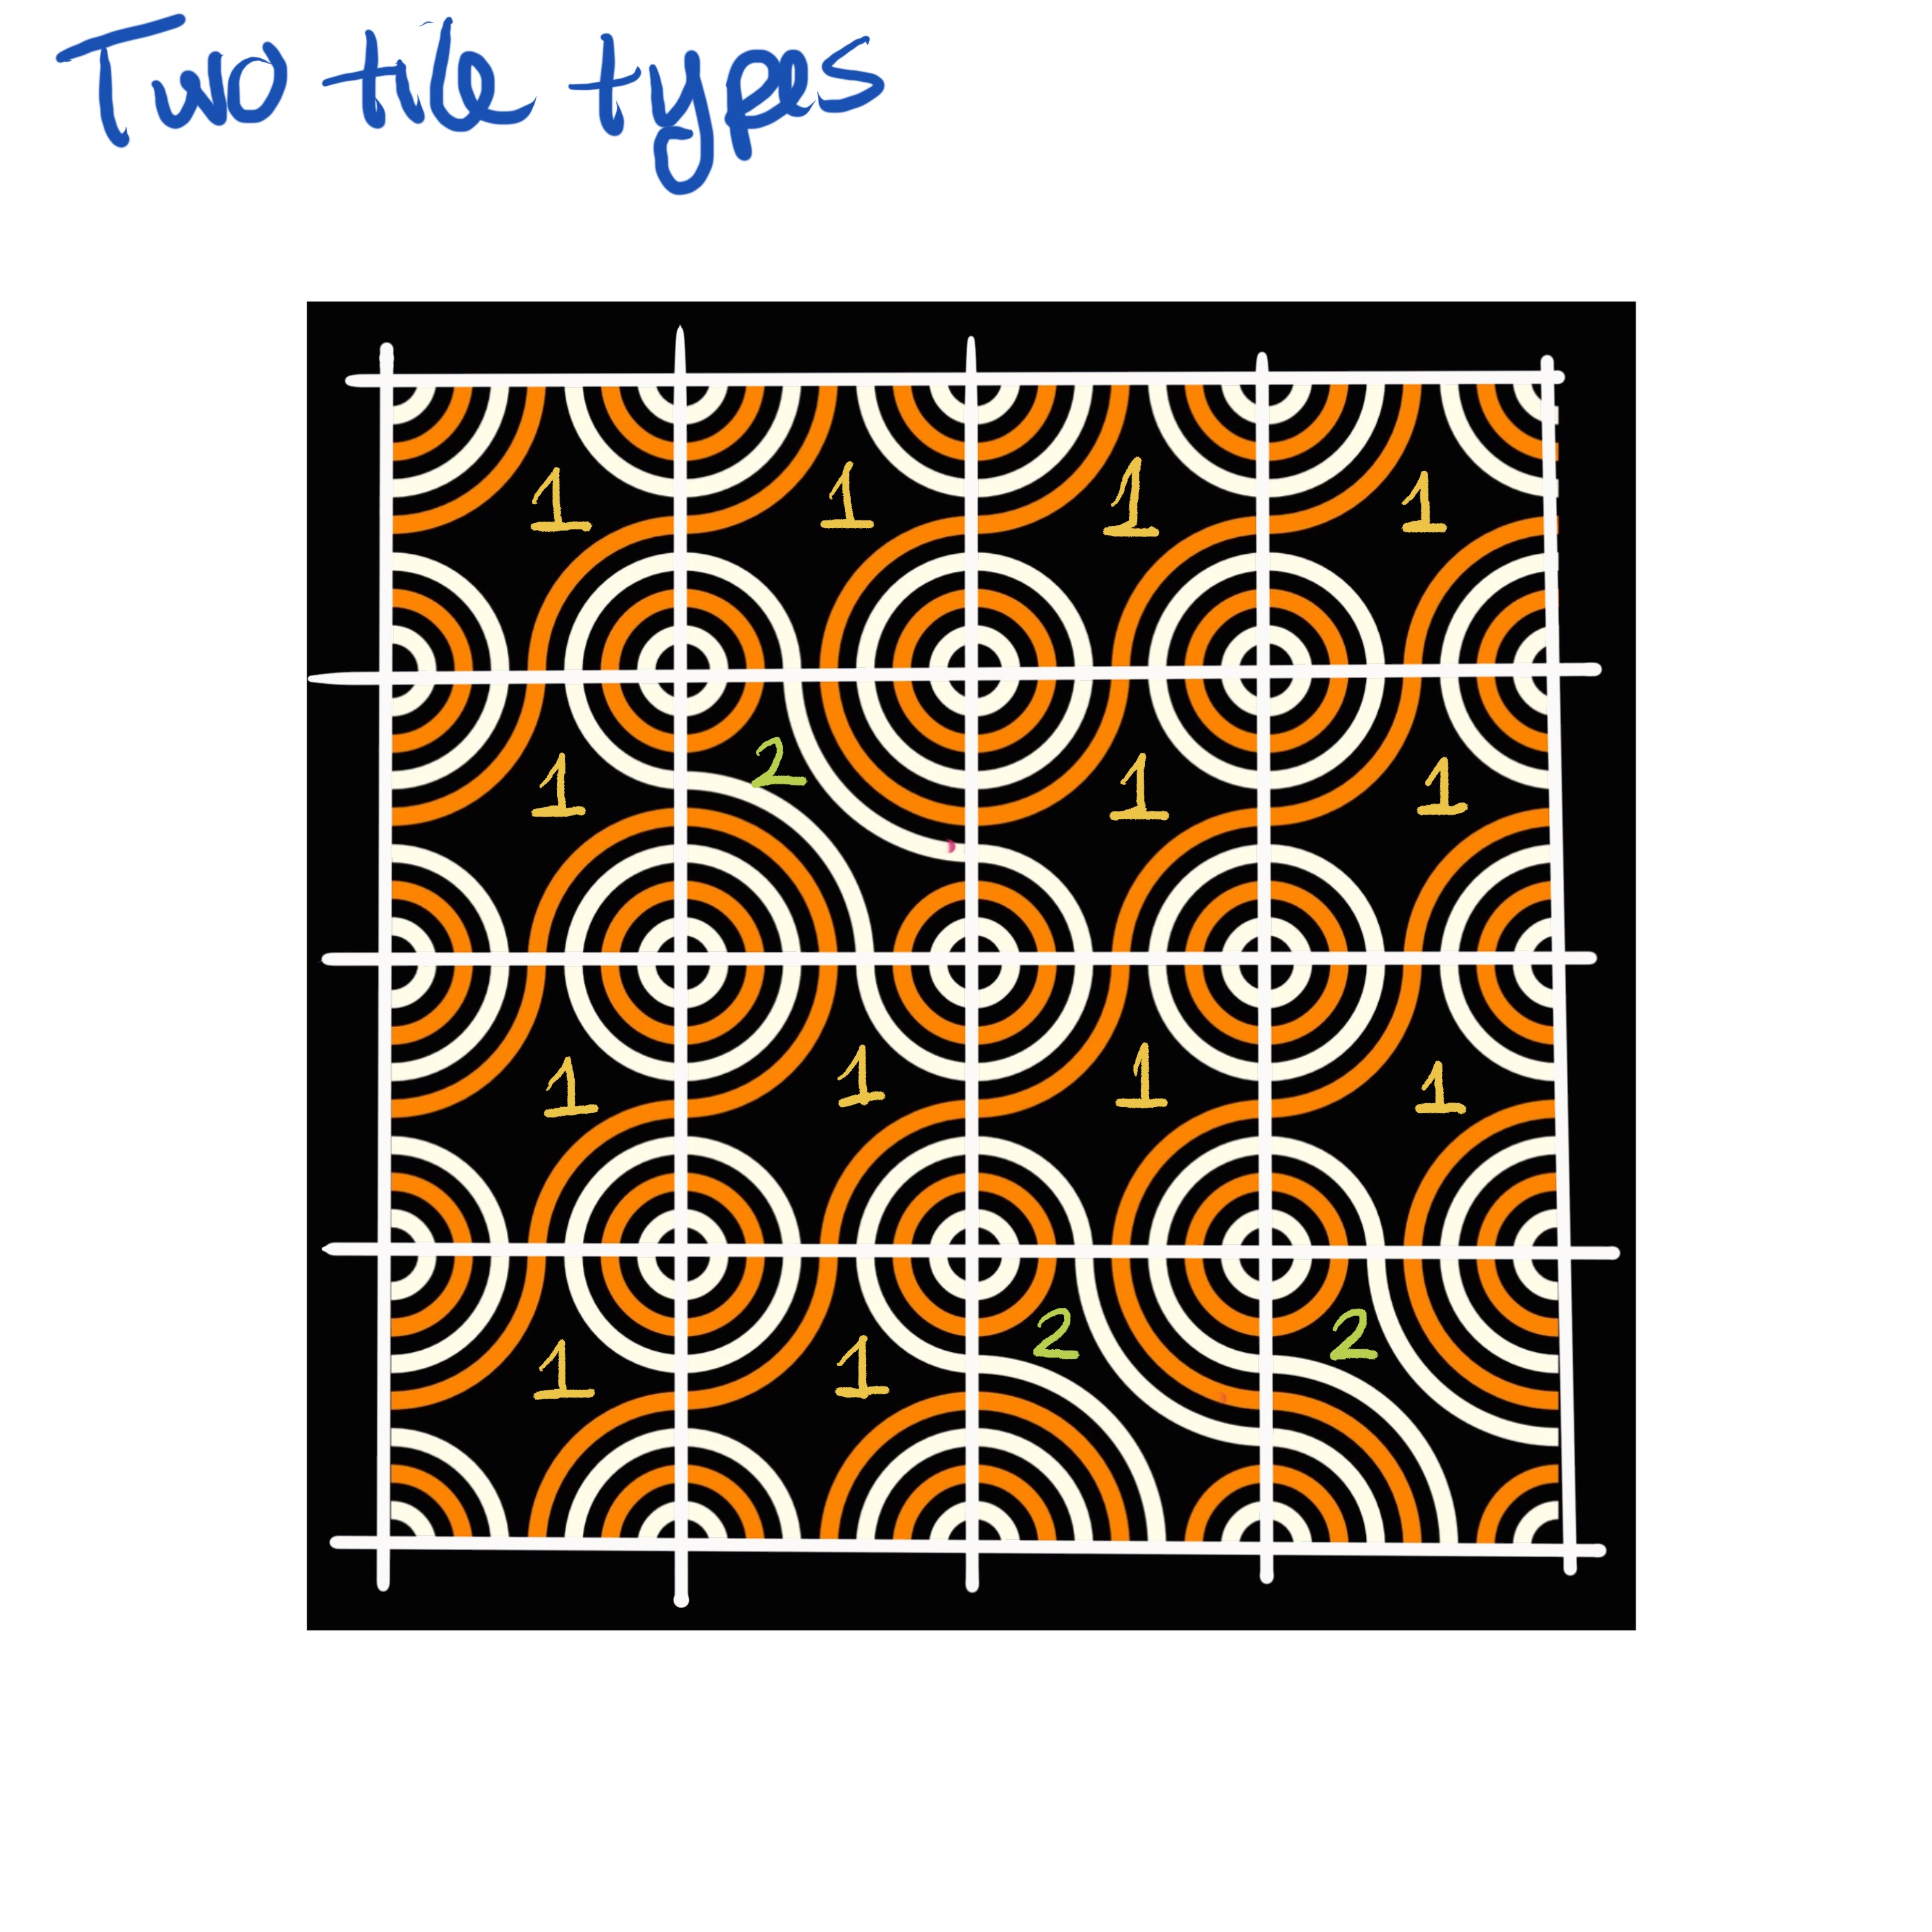
Infinite Truchet: Tiles
Introduction to tiles
Introduction to tiles
Introduction to tiles
Introduction to tiles
The Father of Truchet Tiles
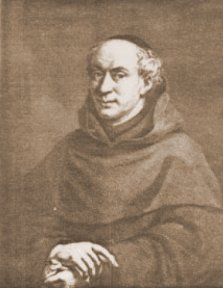
- French Dominican priest, 1657–1729
- Studied typography and invented the first typographic point
- Published “Memoir sur les combinaisons” that invented the idea of truchet tiles
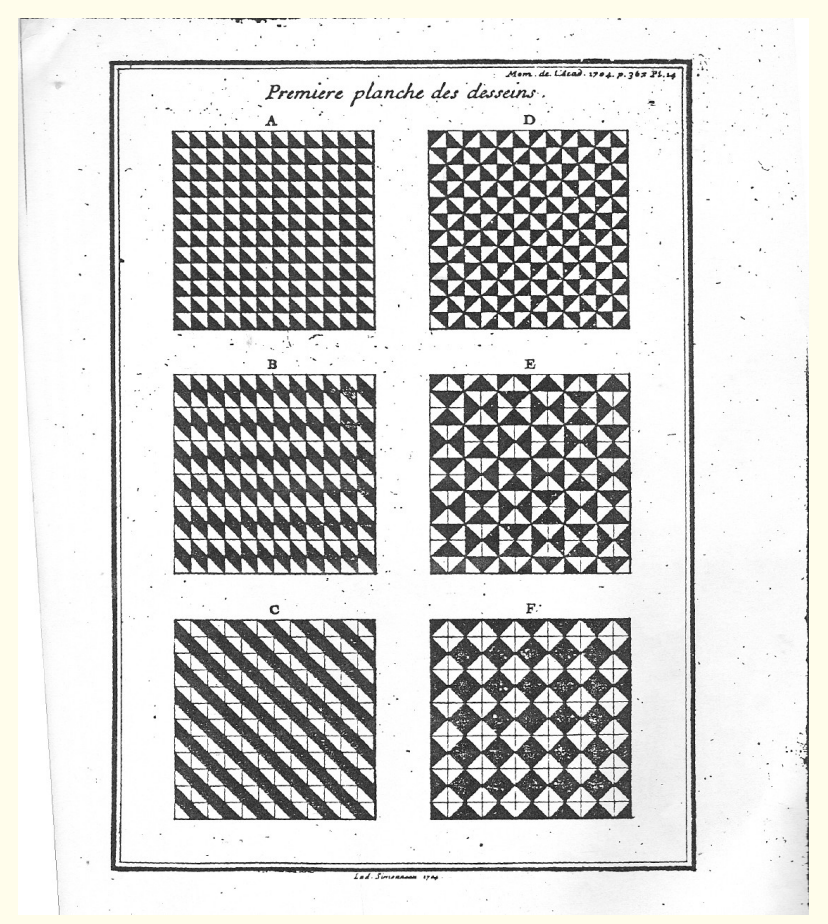
“Memoir sur les combinaisons”
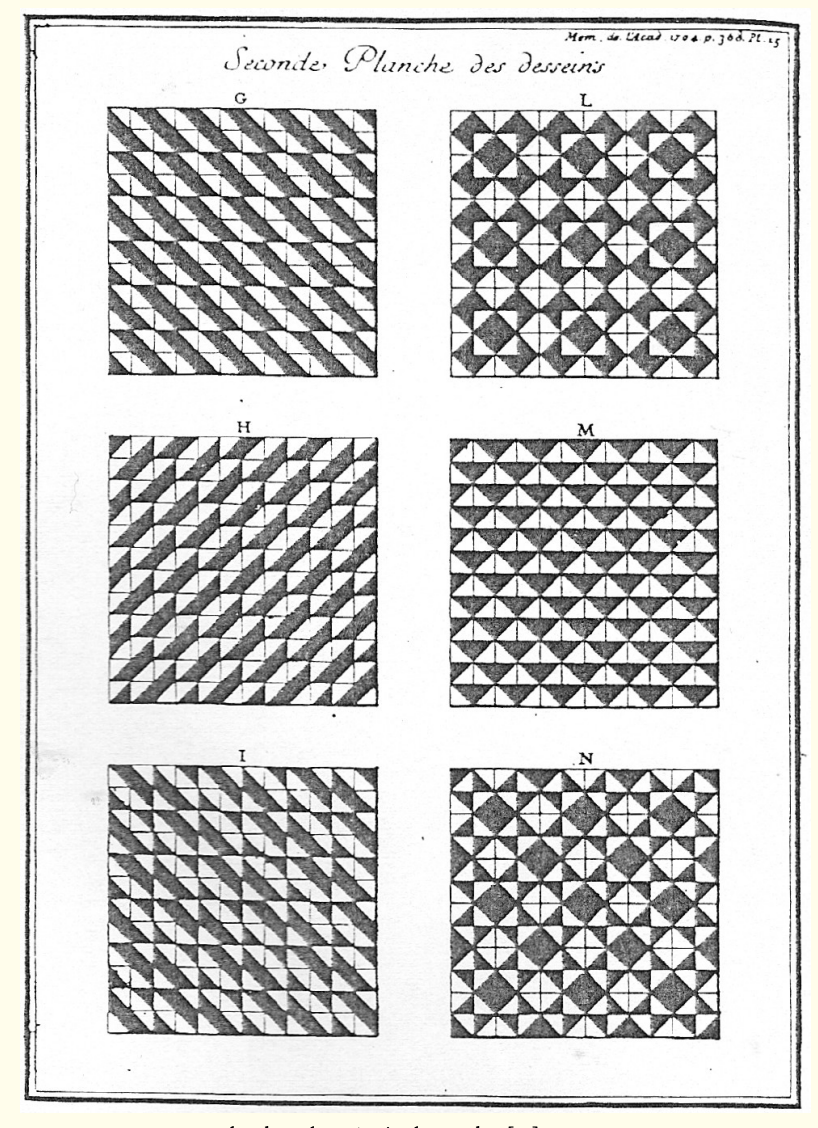
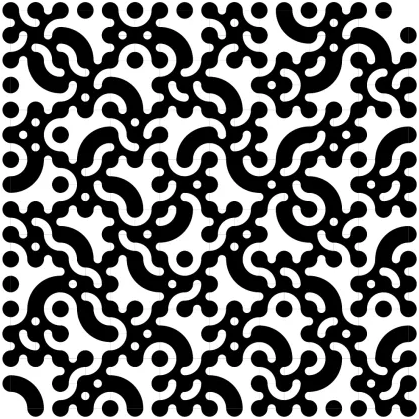
- Studied a pattern where square tiles are split by diagonal lines into two triangles with contrasting colors.
- By placing these tiles adjacent to each other but in different orientations, many different patterns can be formed.
Truchet Tiles
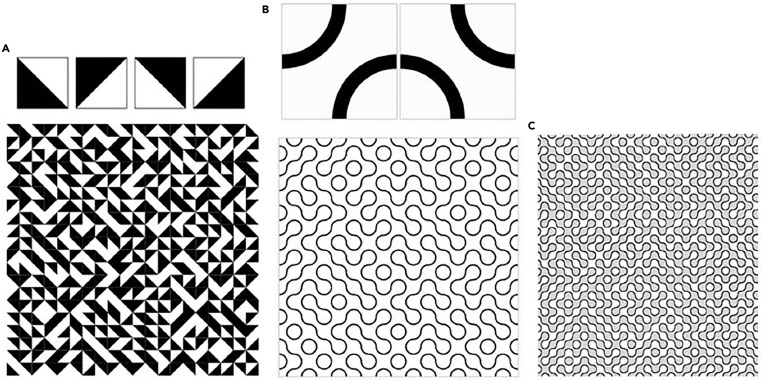
Initially, the underlying idea of truchet tiles is that adjacent tiles of right triangles make larger connecting patterns.
Truchet Tiles
Cyril Smith, 1987, analyzed truchet tiles and abstracted them into 1) diagonal lines, then 2) two arcs starting and ending at midpoints of the tiles edges.
Robert J. Krawczyk, 2020
Multi-Scale Truchet Patterns
Exercise 1
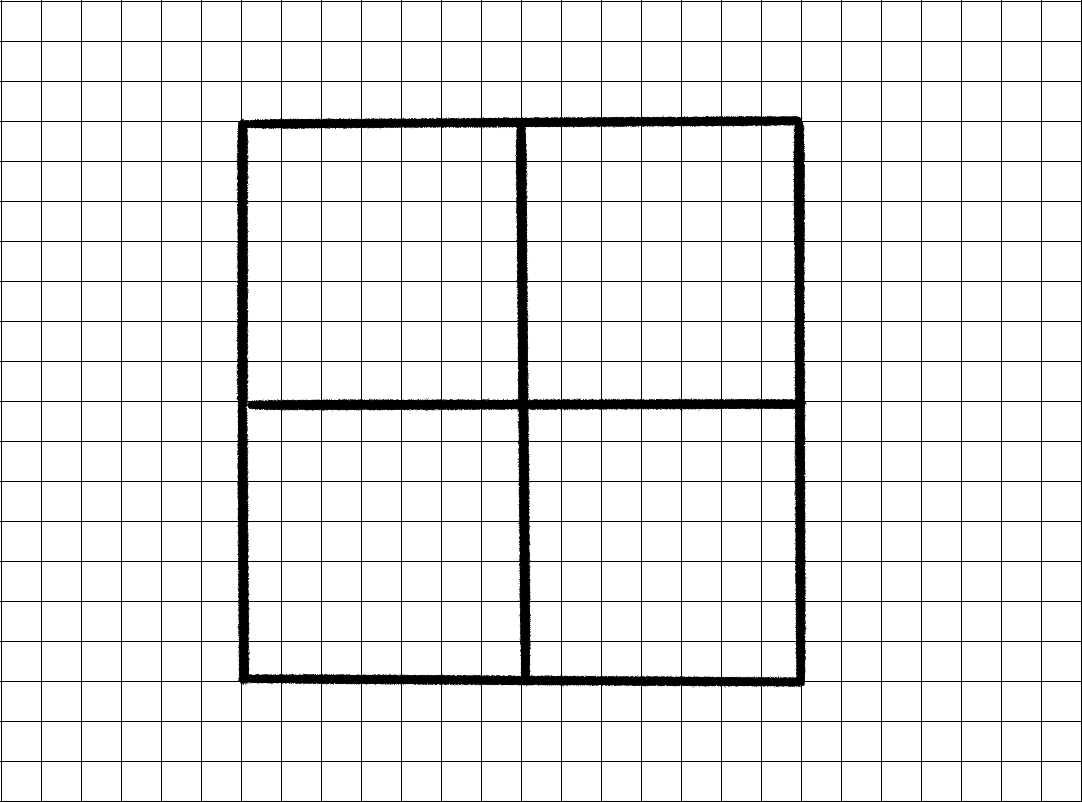
- Open the
exercises/05-infinite-truchet/truchet_tiles_examplesdirectory. These are different examples of truchet tiles. Choose one example. - Draw four squares on your graphing paper in a 2x2 format (see above).
- Draw four different rotations of your selected truchet tile example.
- Take a picture of your piece when finished and share it on the Github Discussions page.
10:00
The simplifying of trigonometry
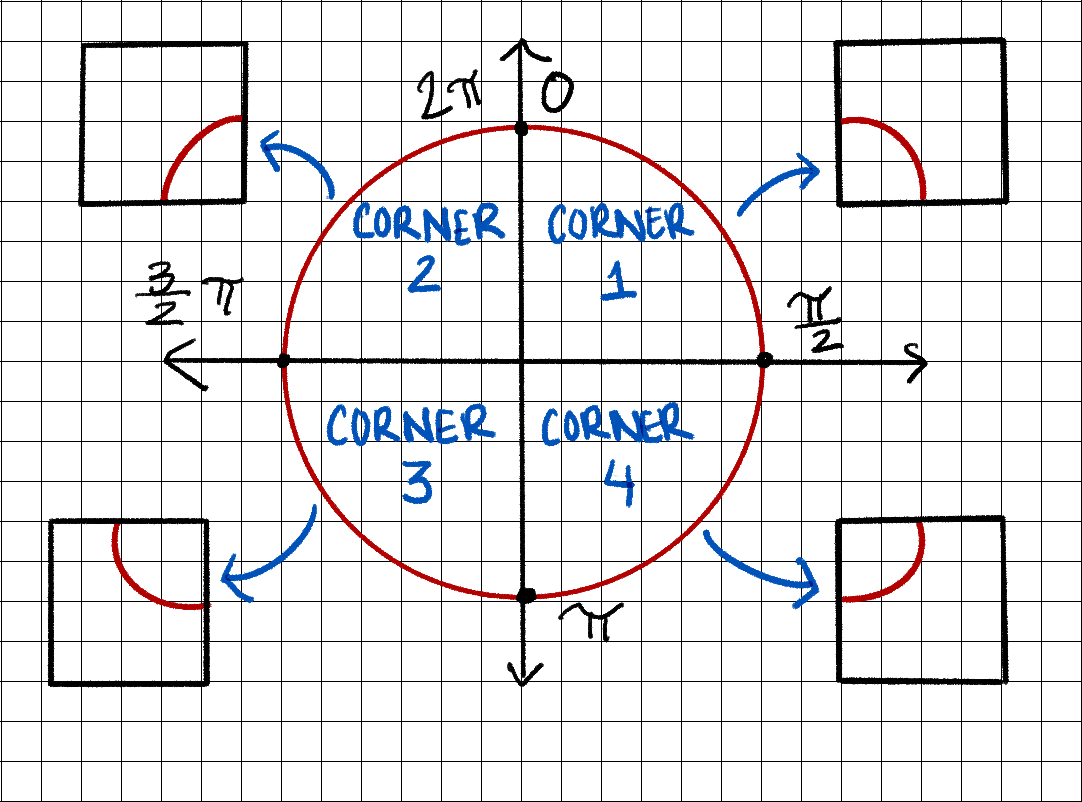
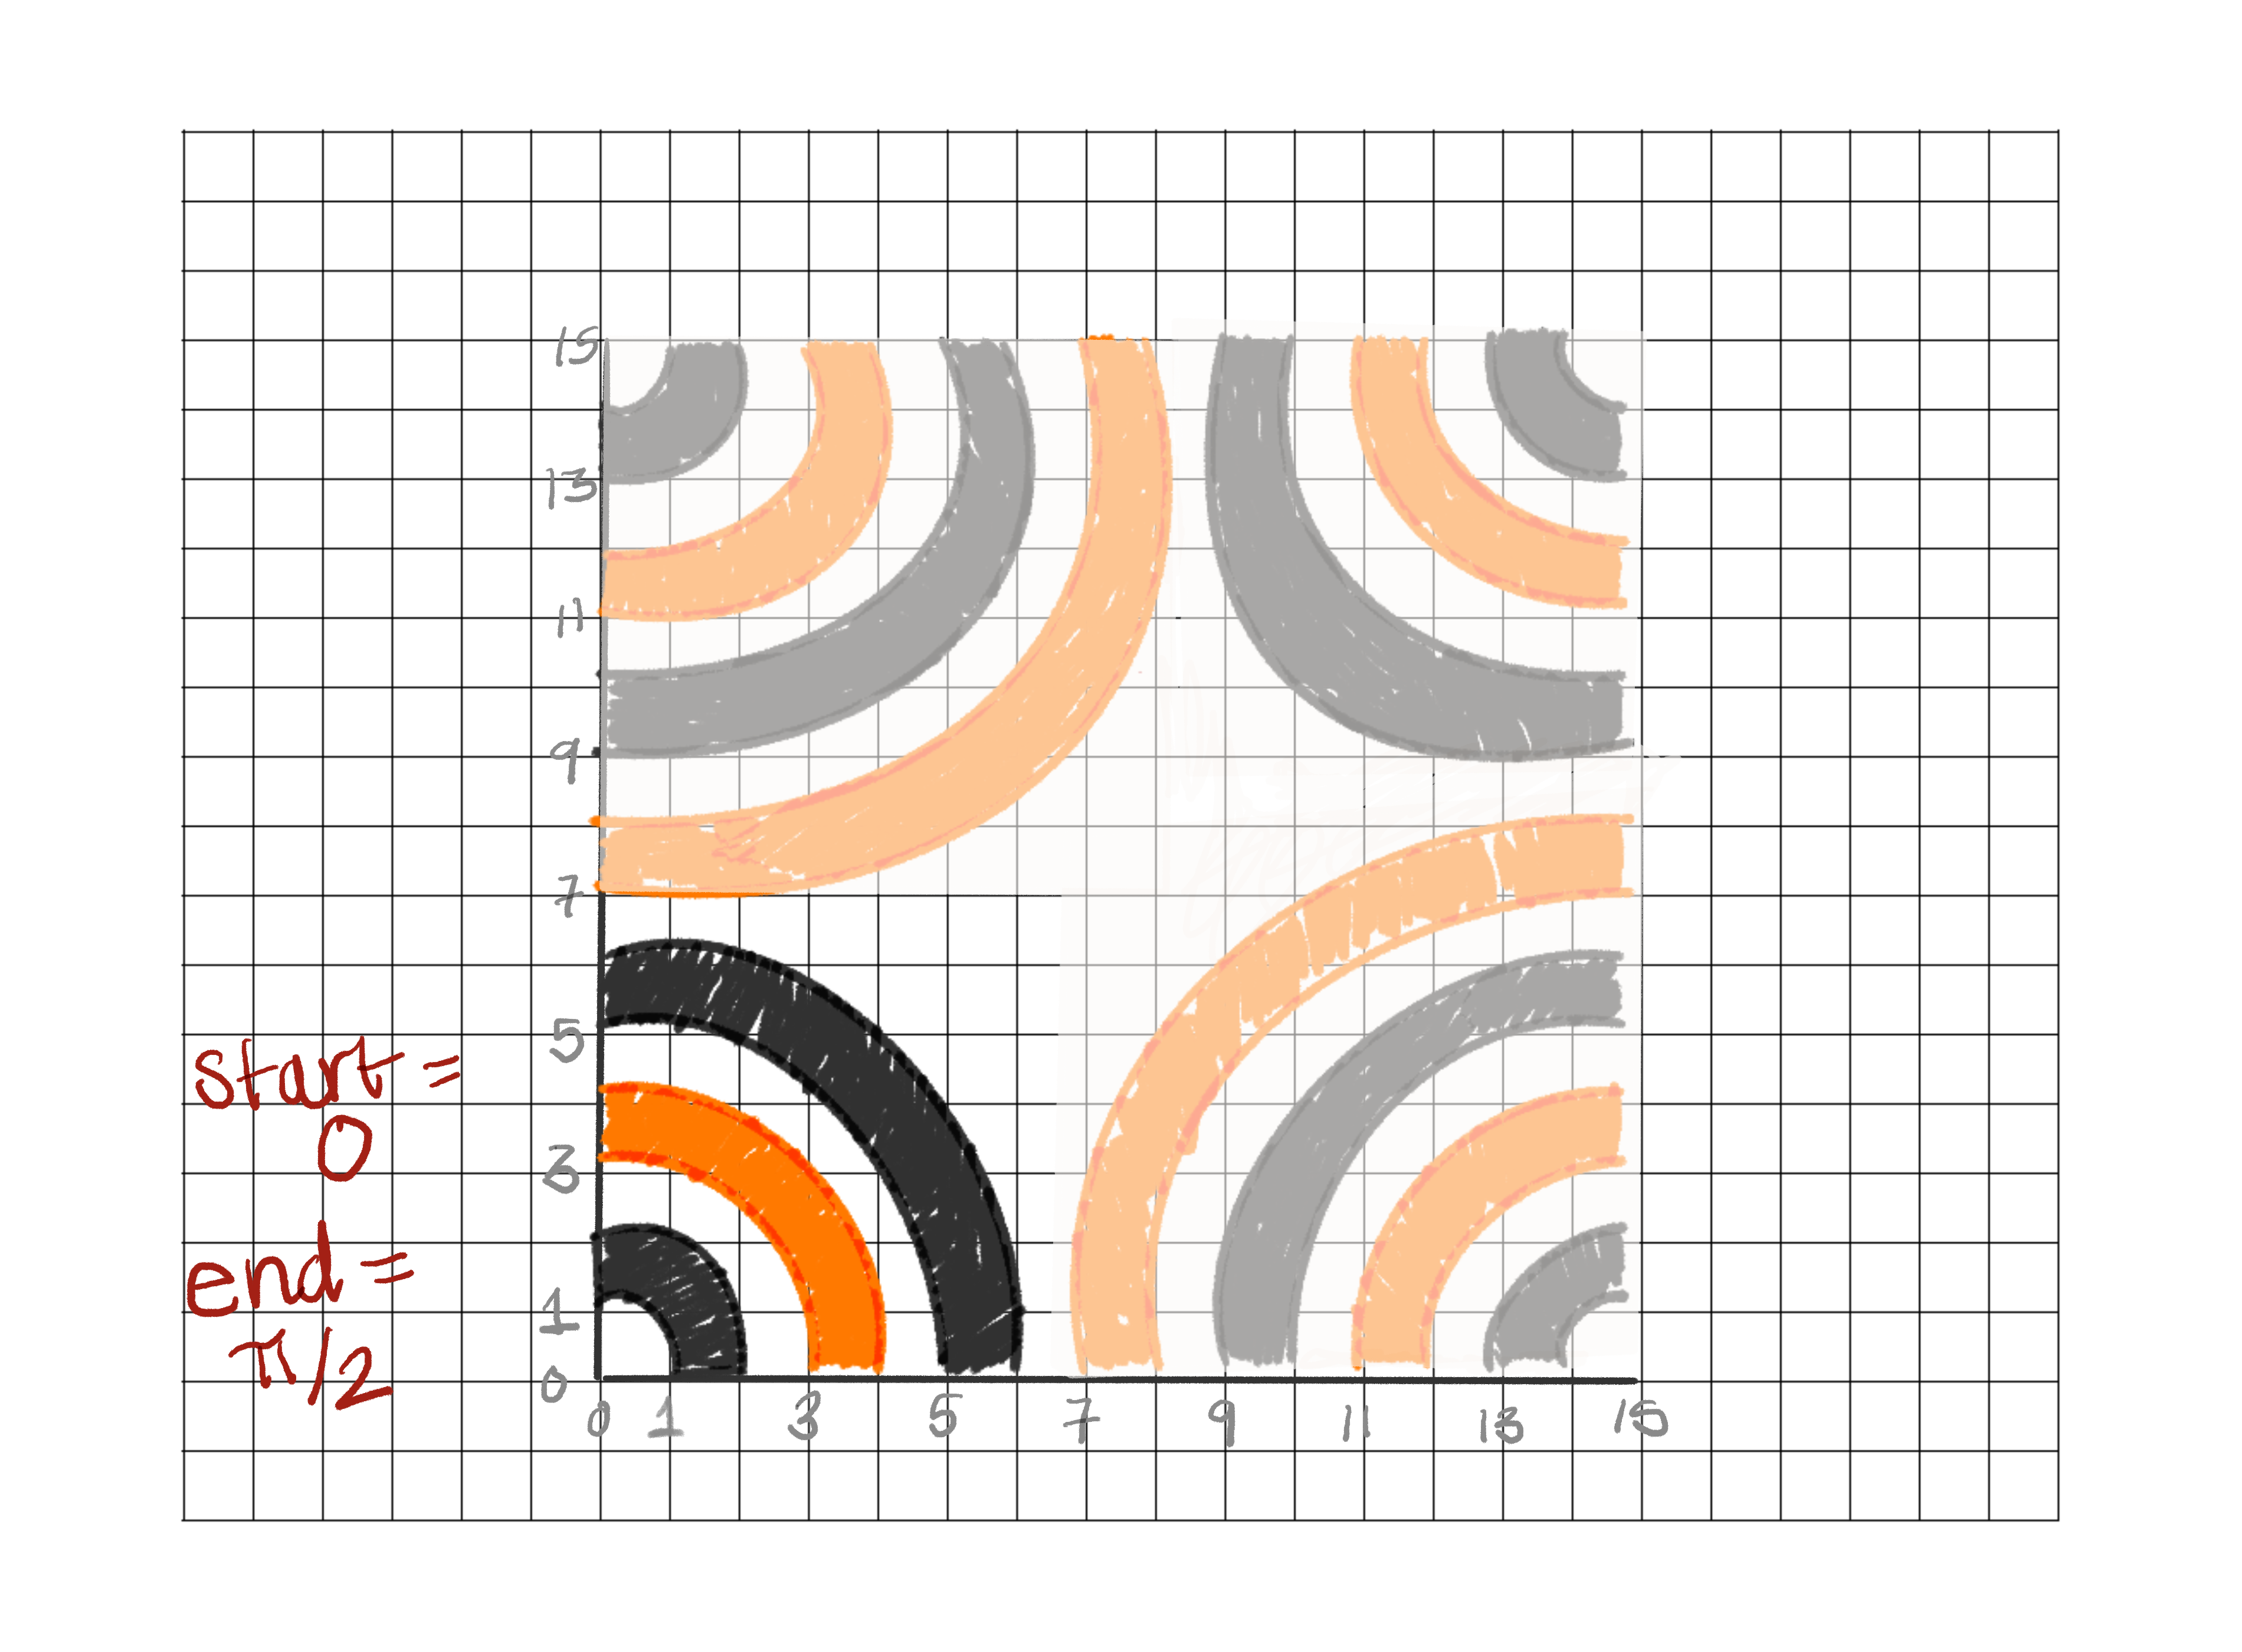
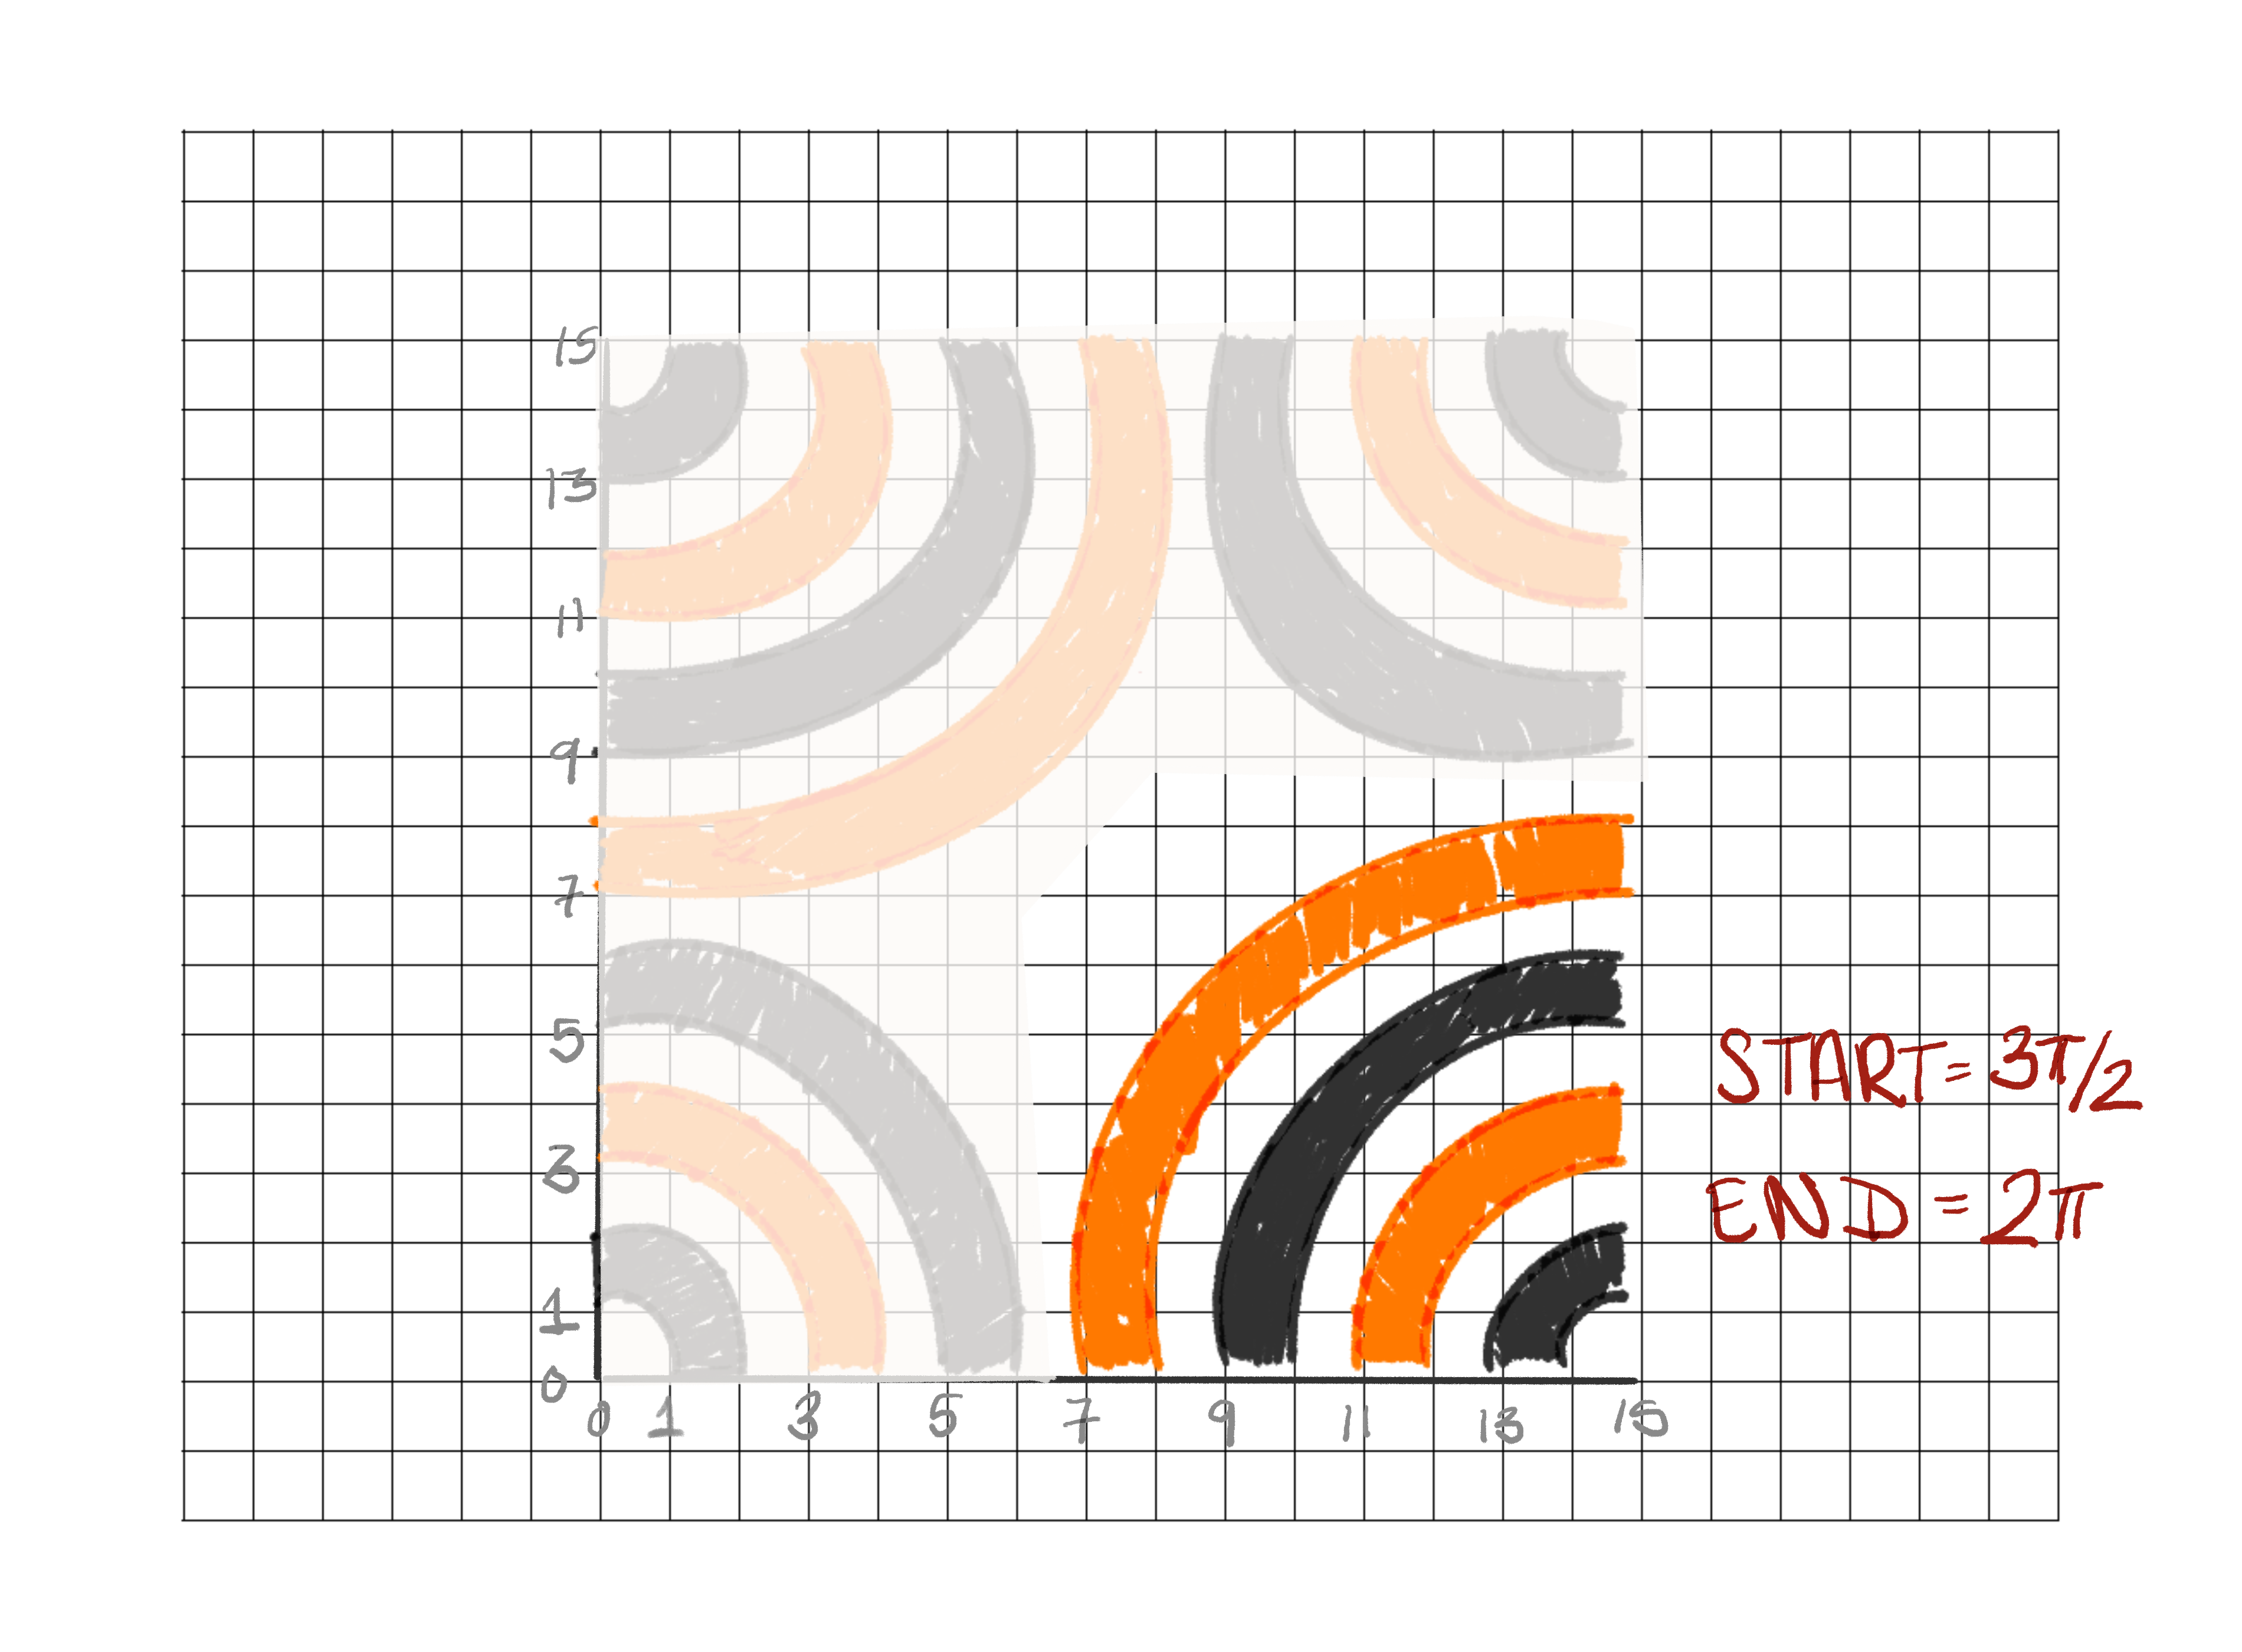
geom_arc_bar() arguments: x0, y0, start, end
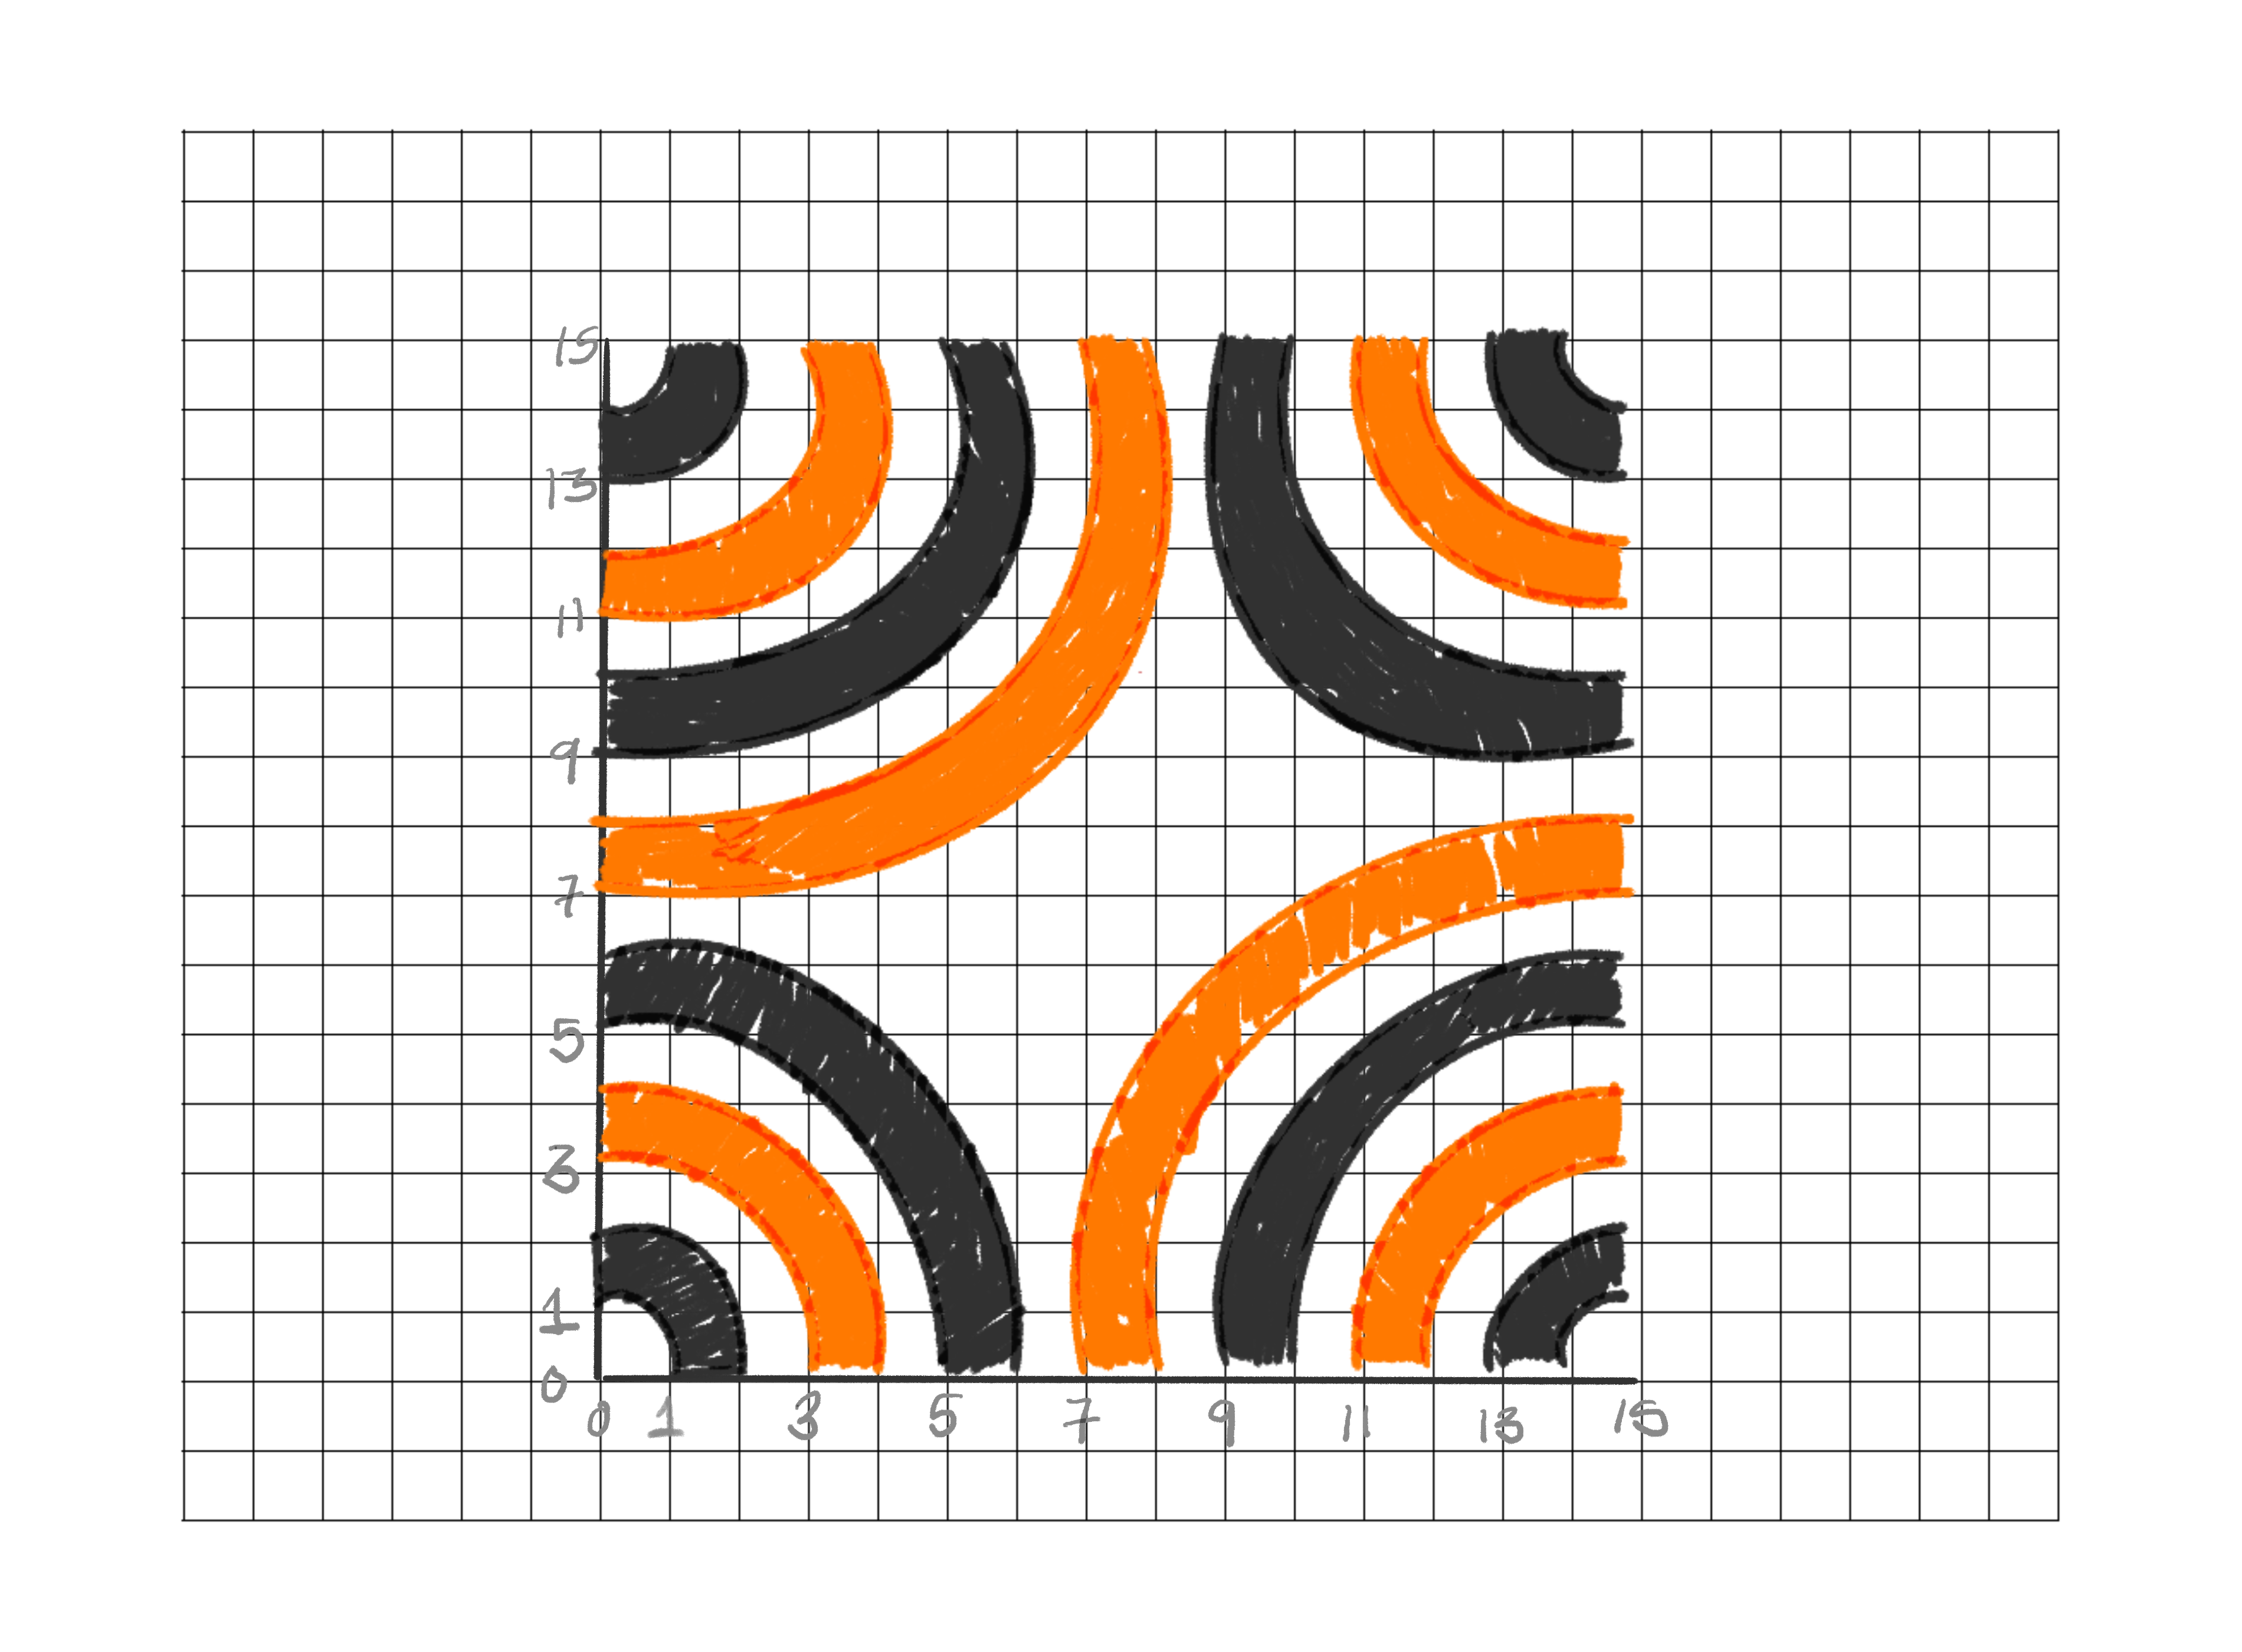
geom_arc_bar() arguments: x0, y0, start, end
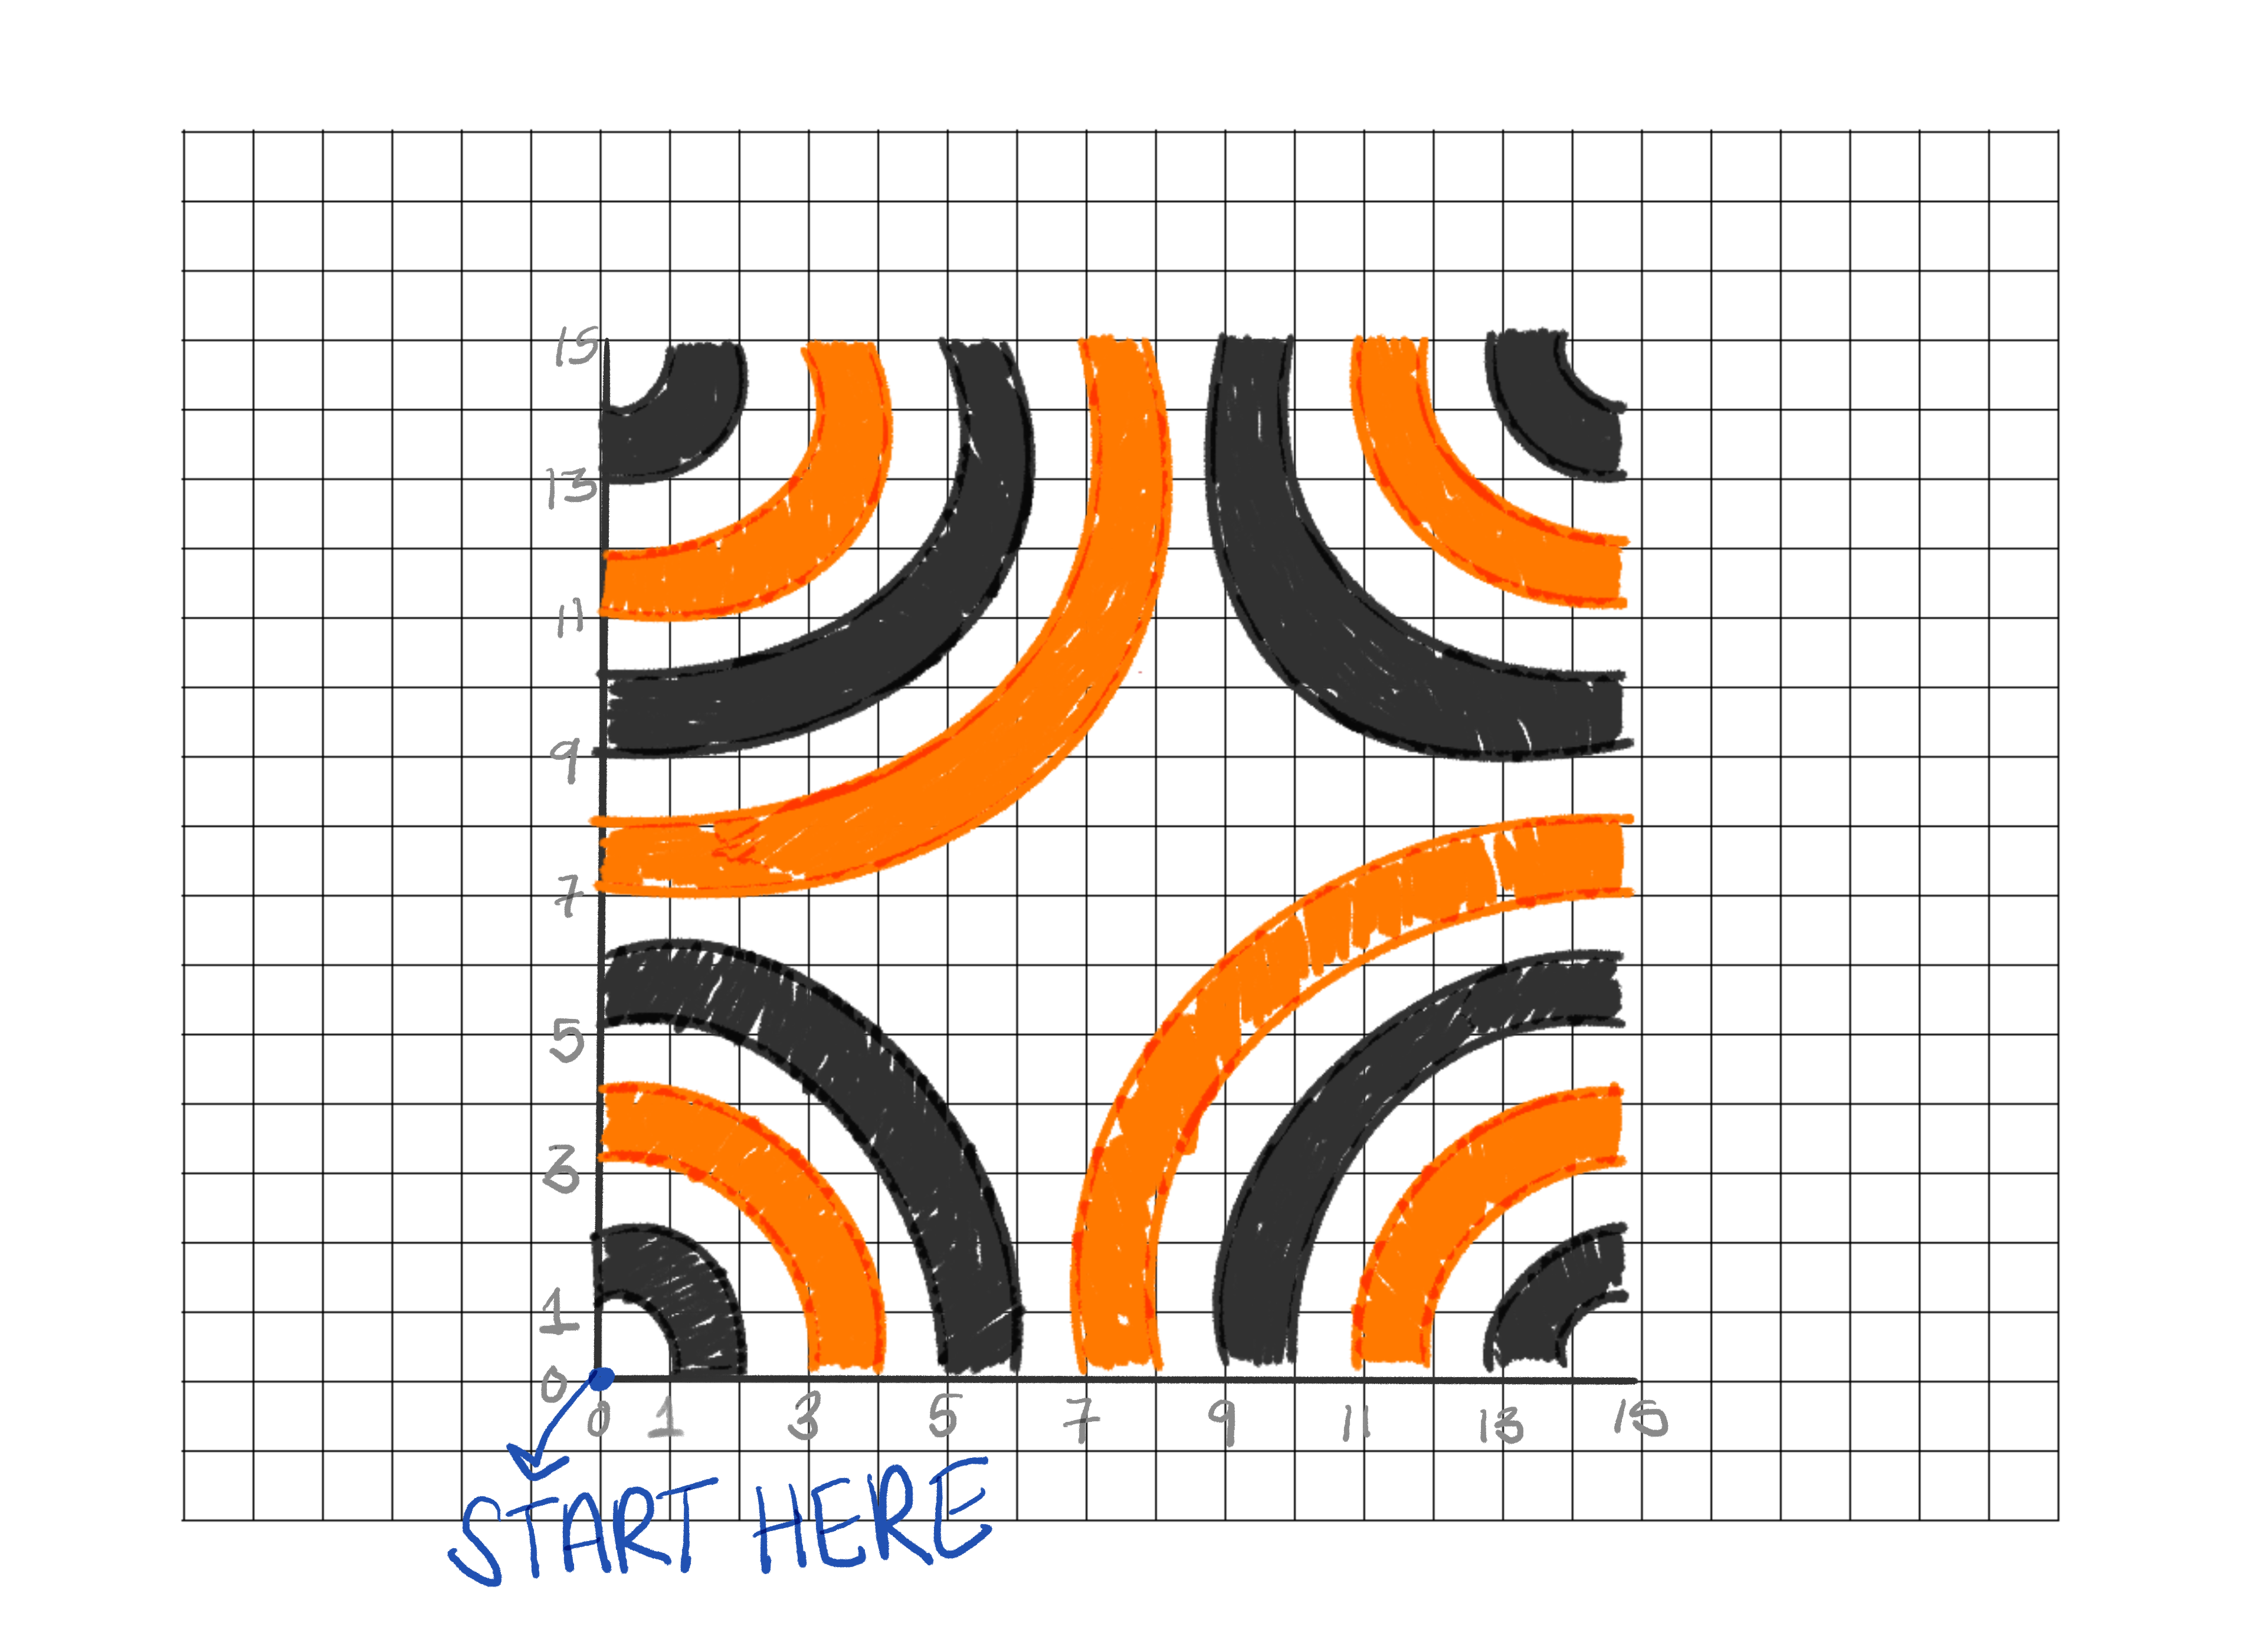
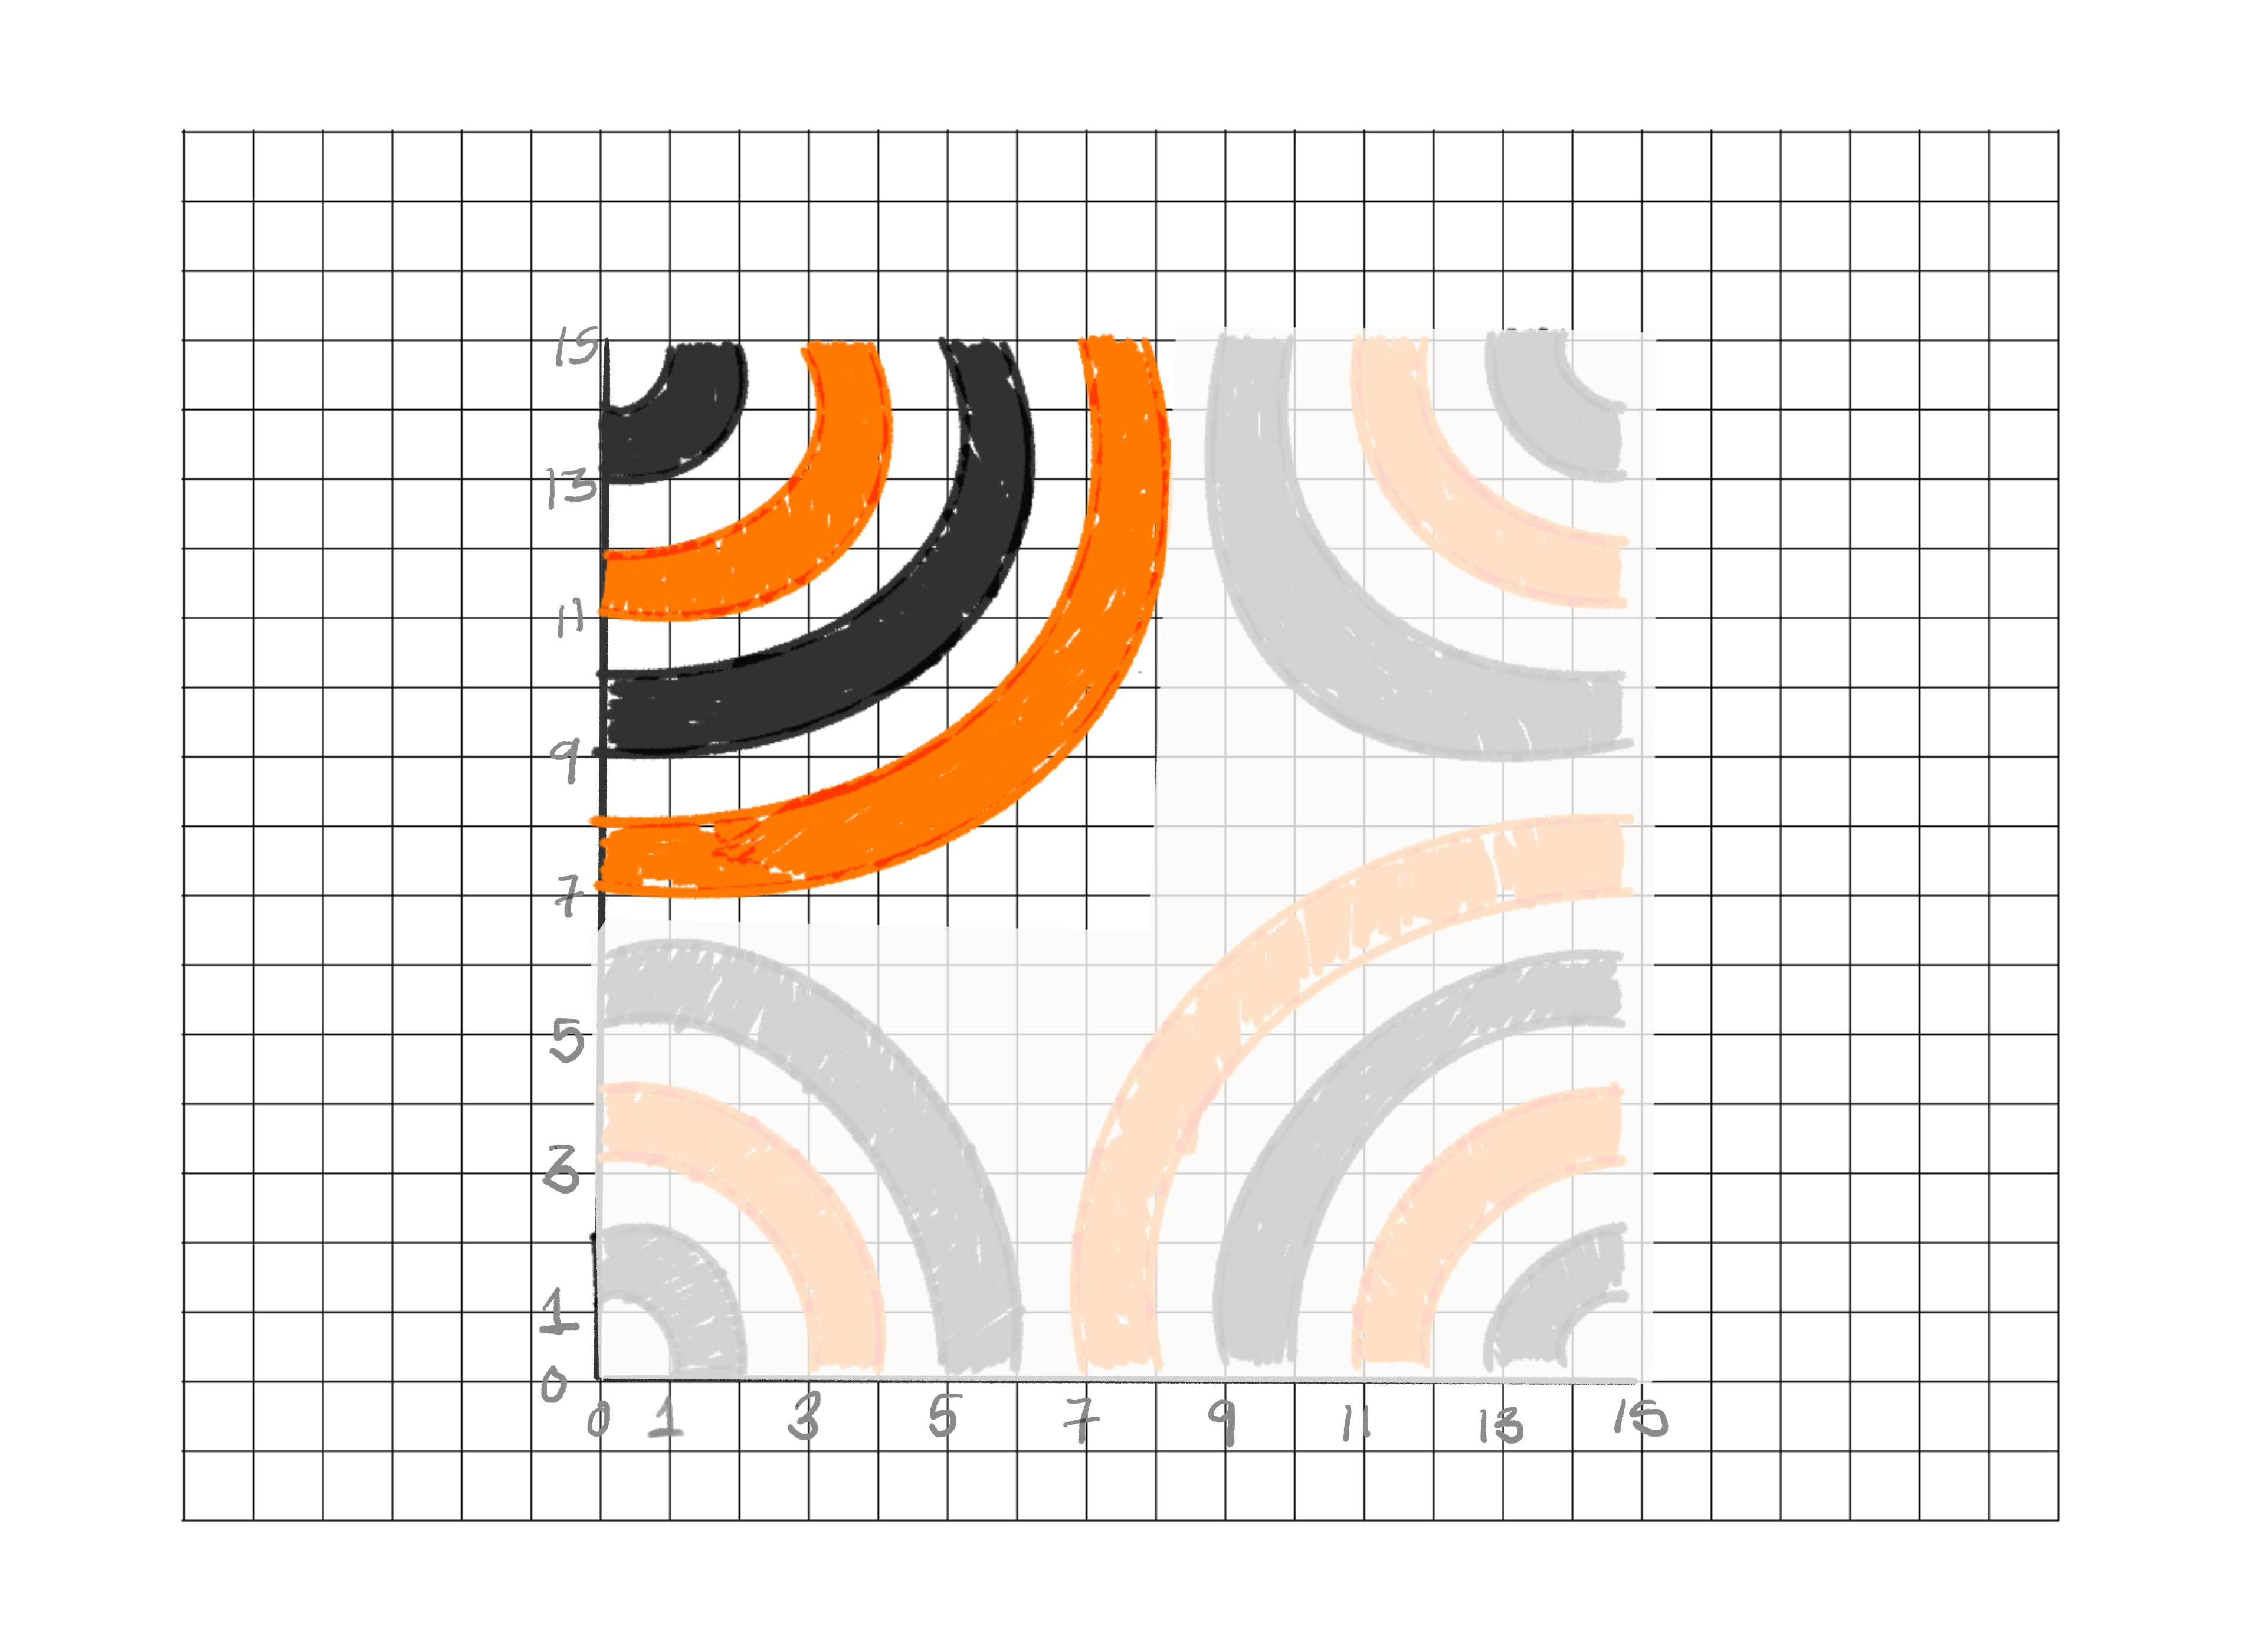
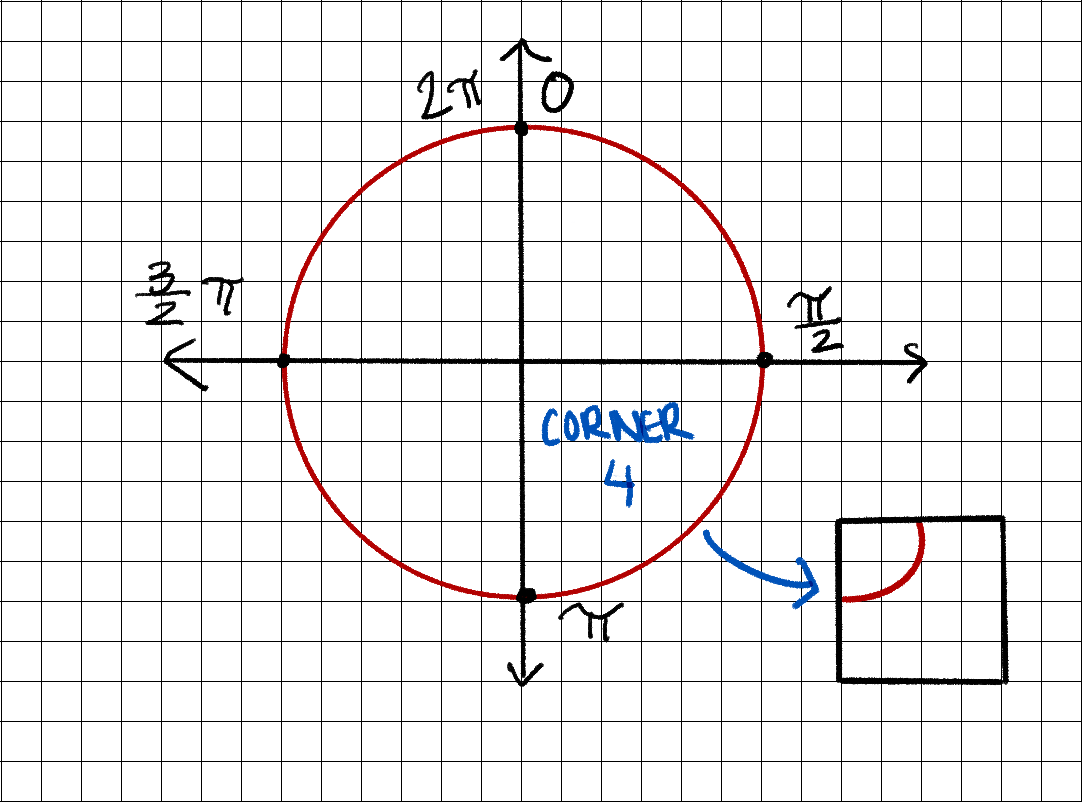
Always travel counterclockwise, starting in bottom left
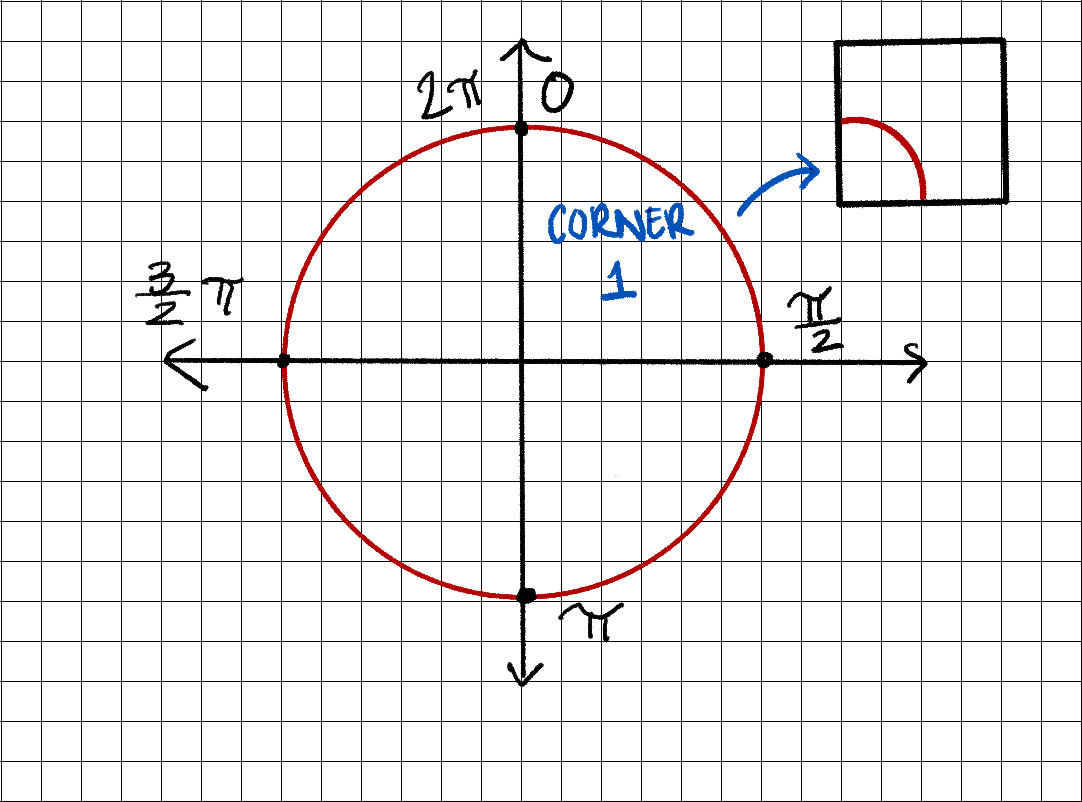
Corner 1
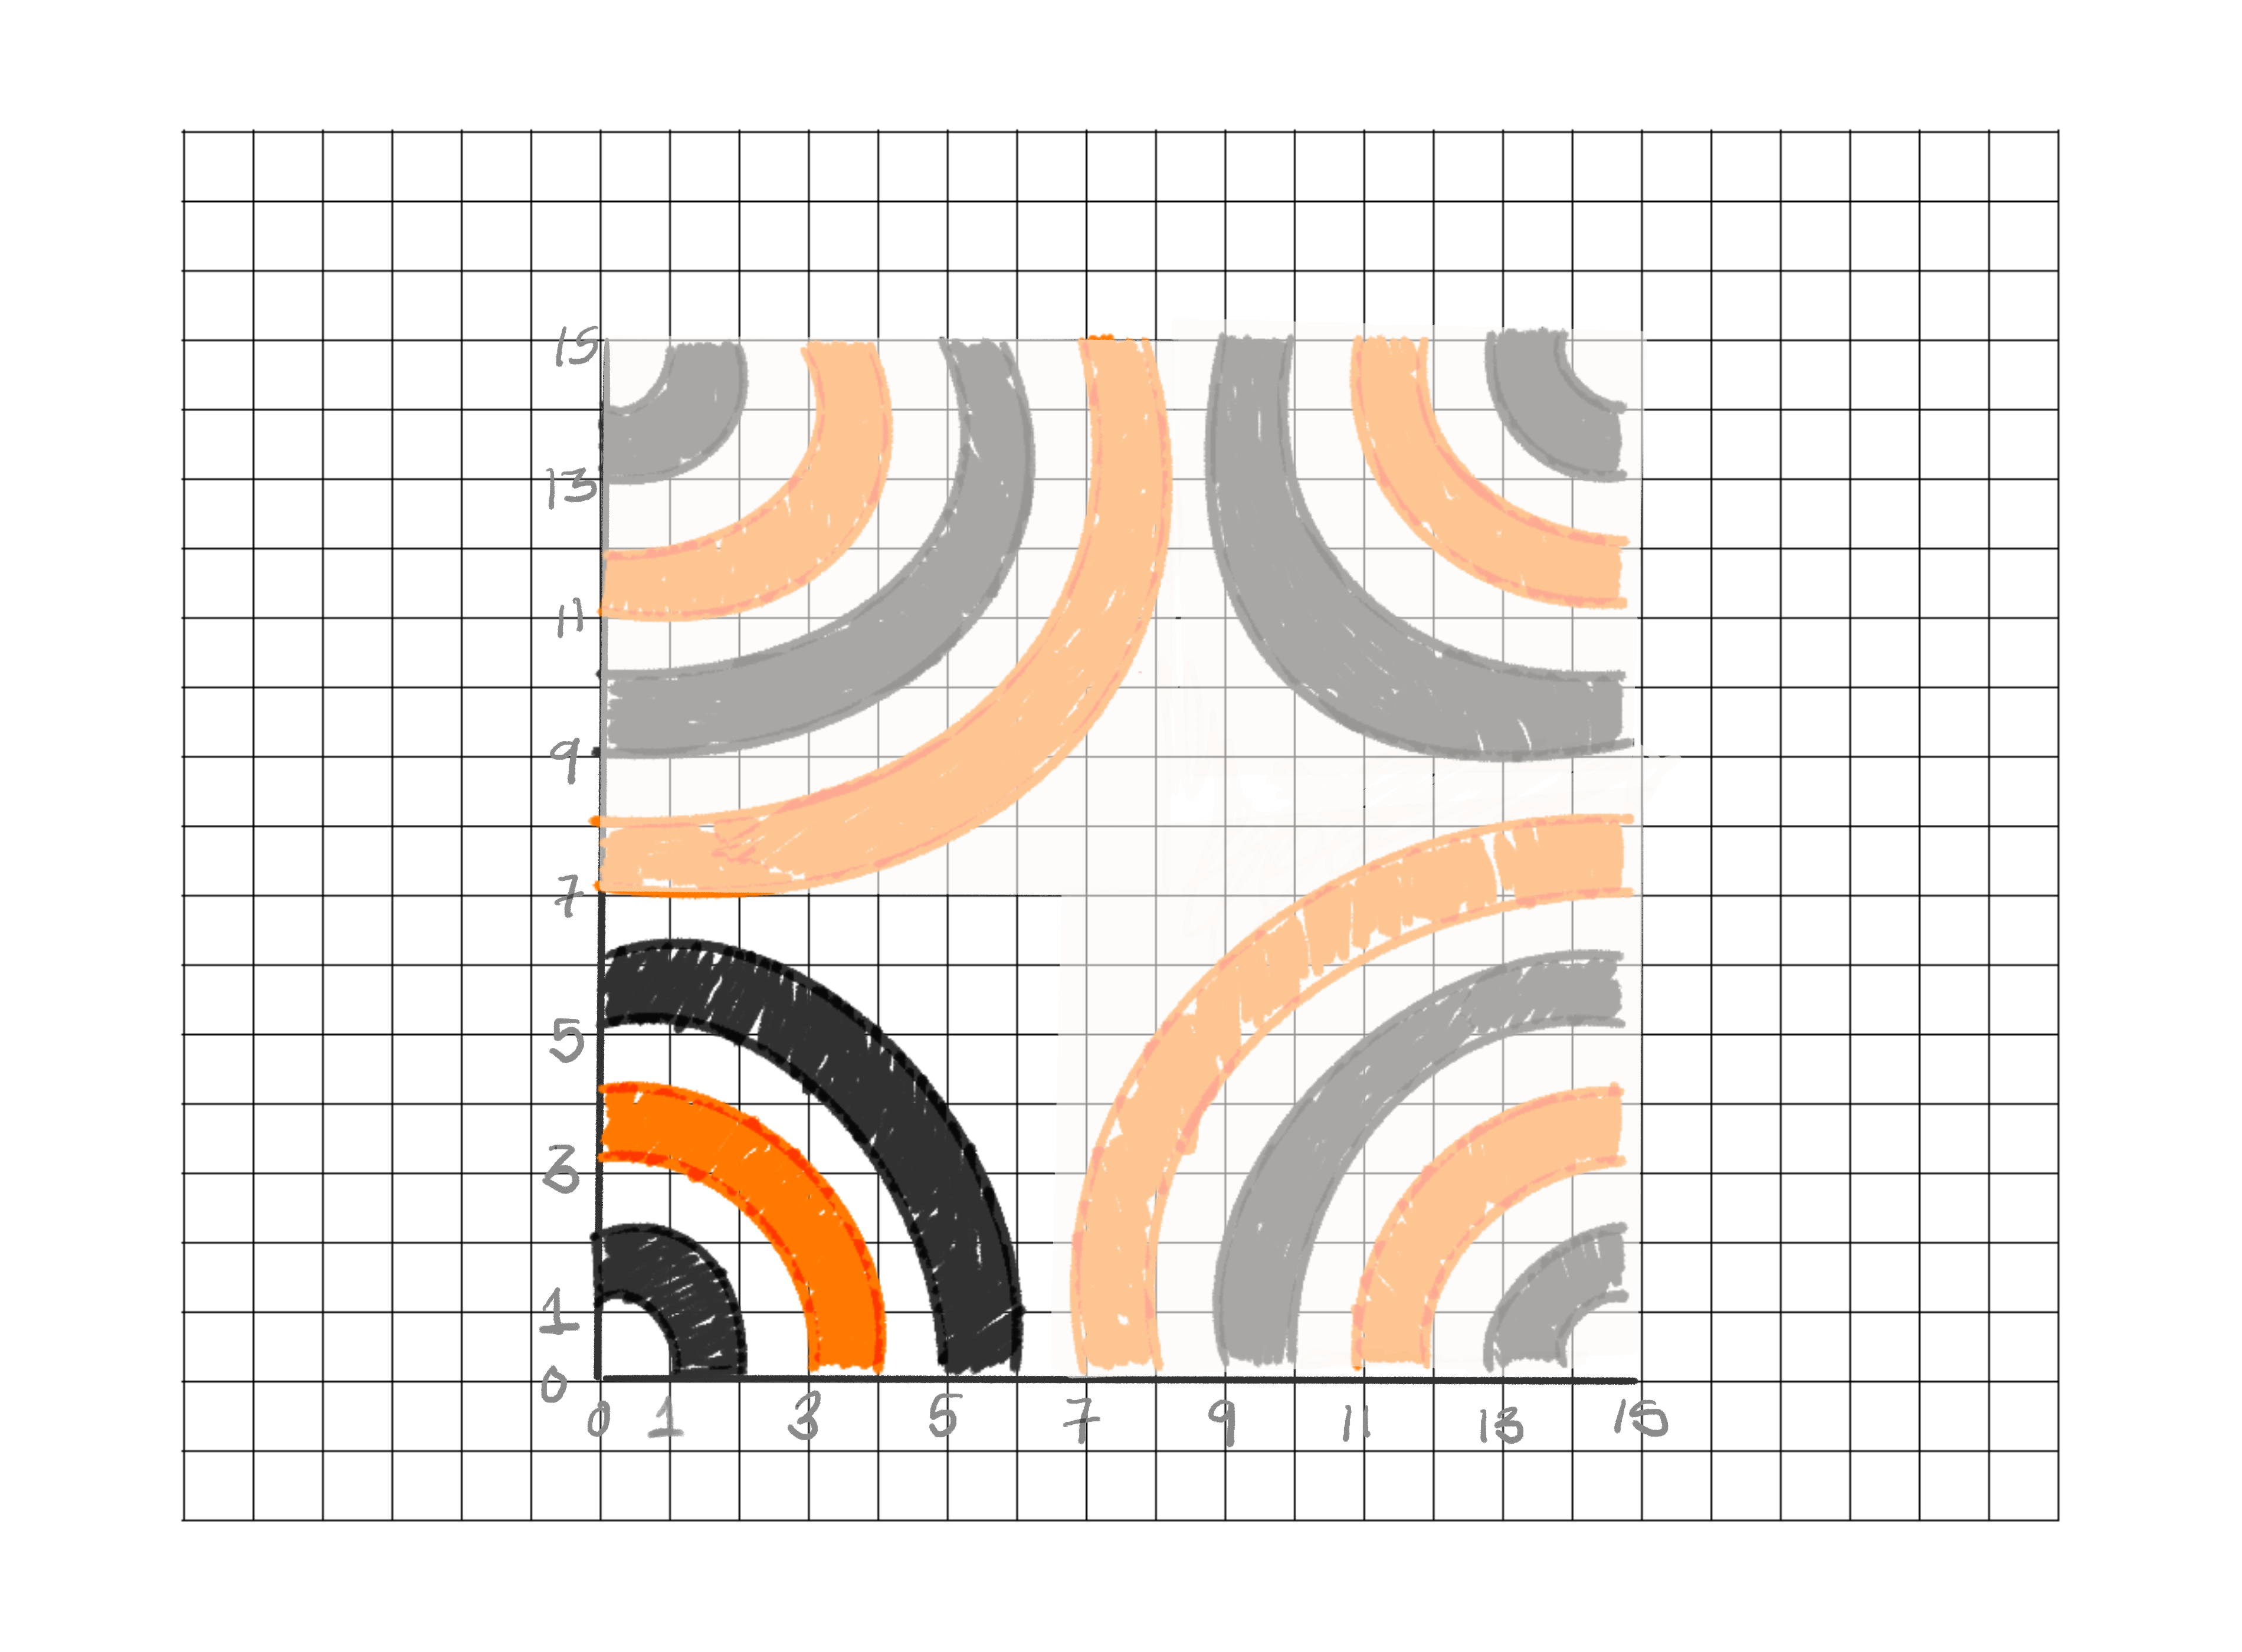
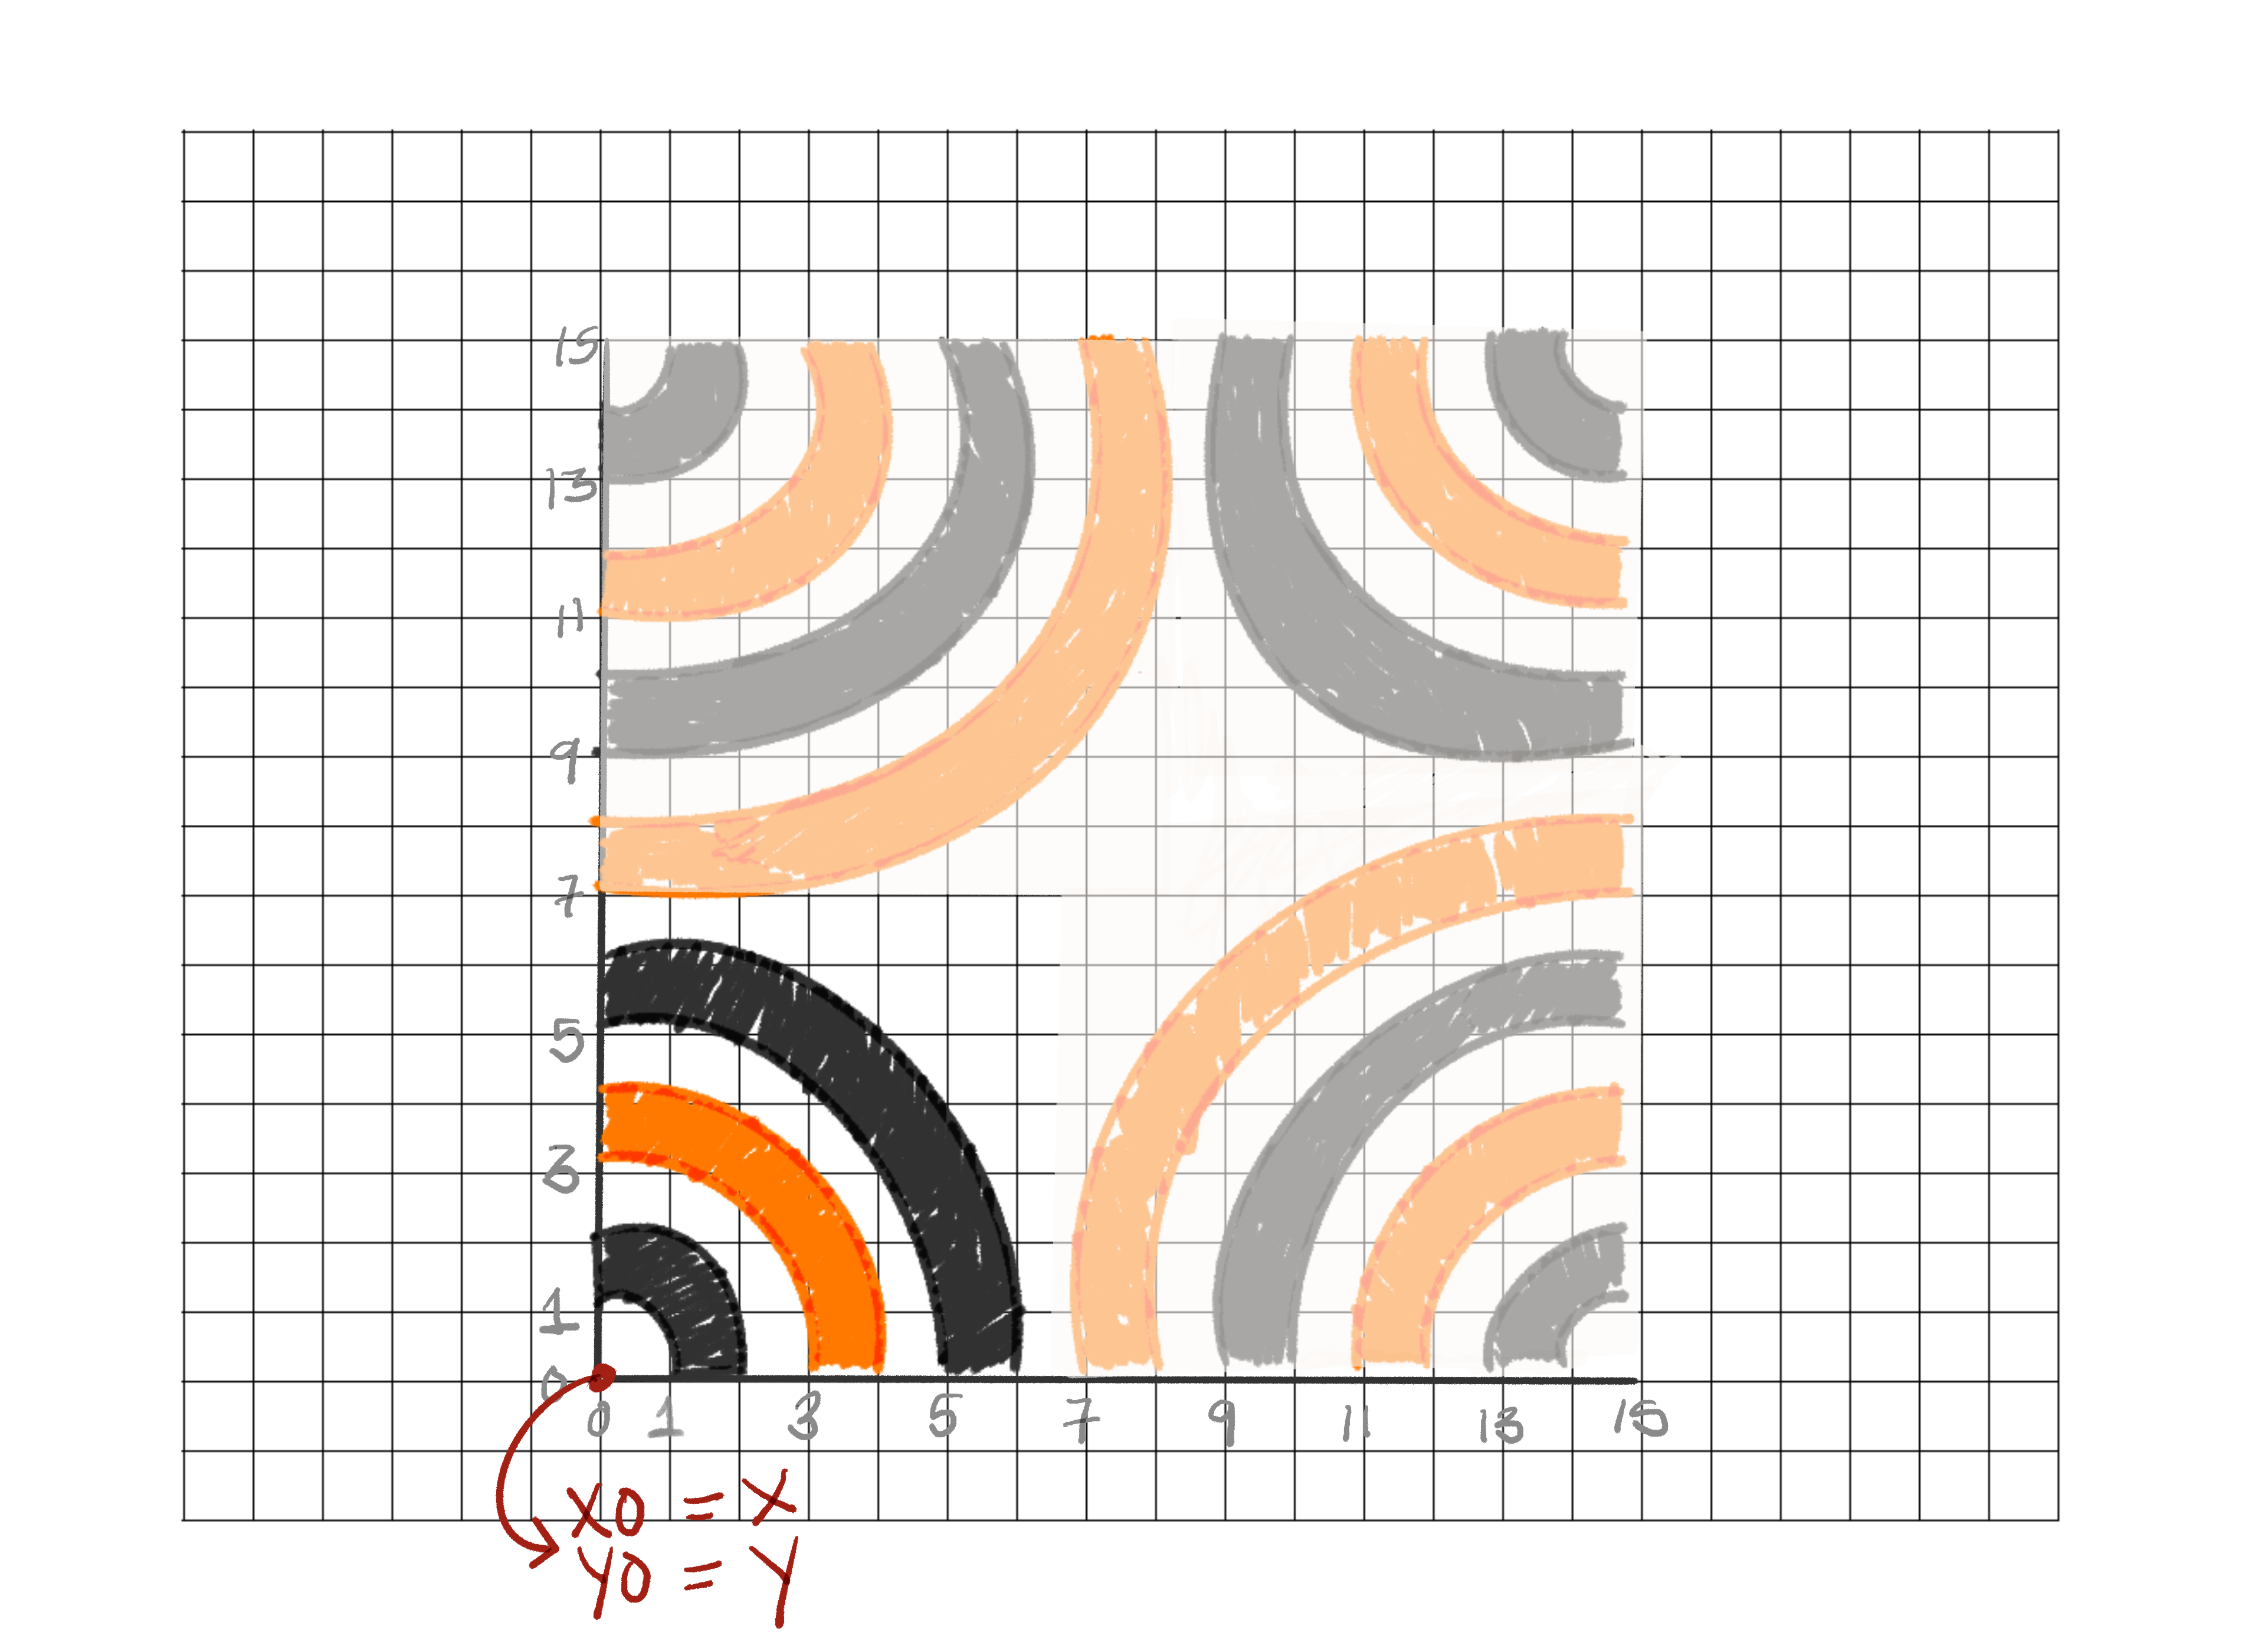
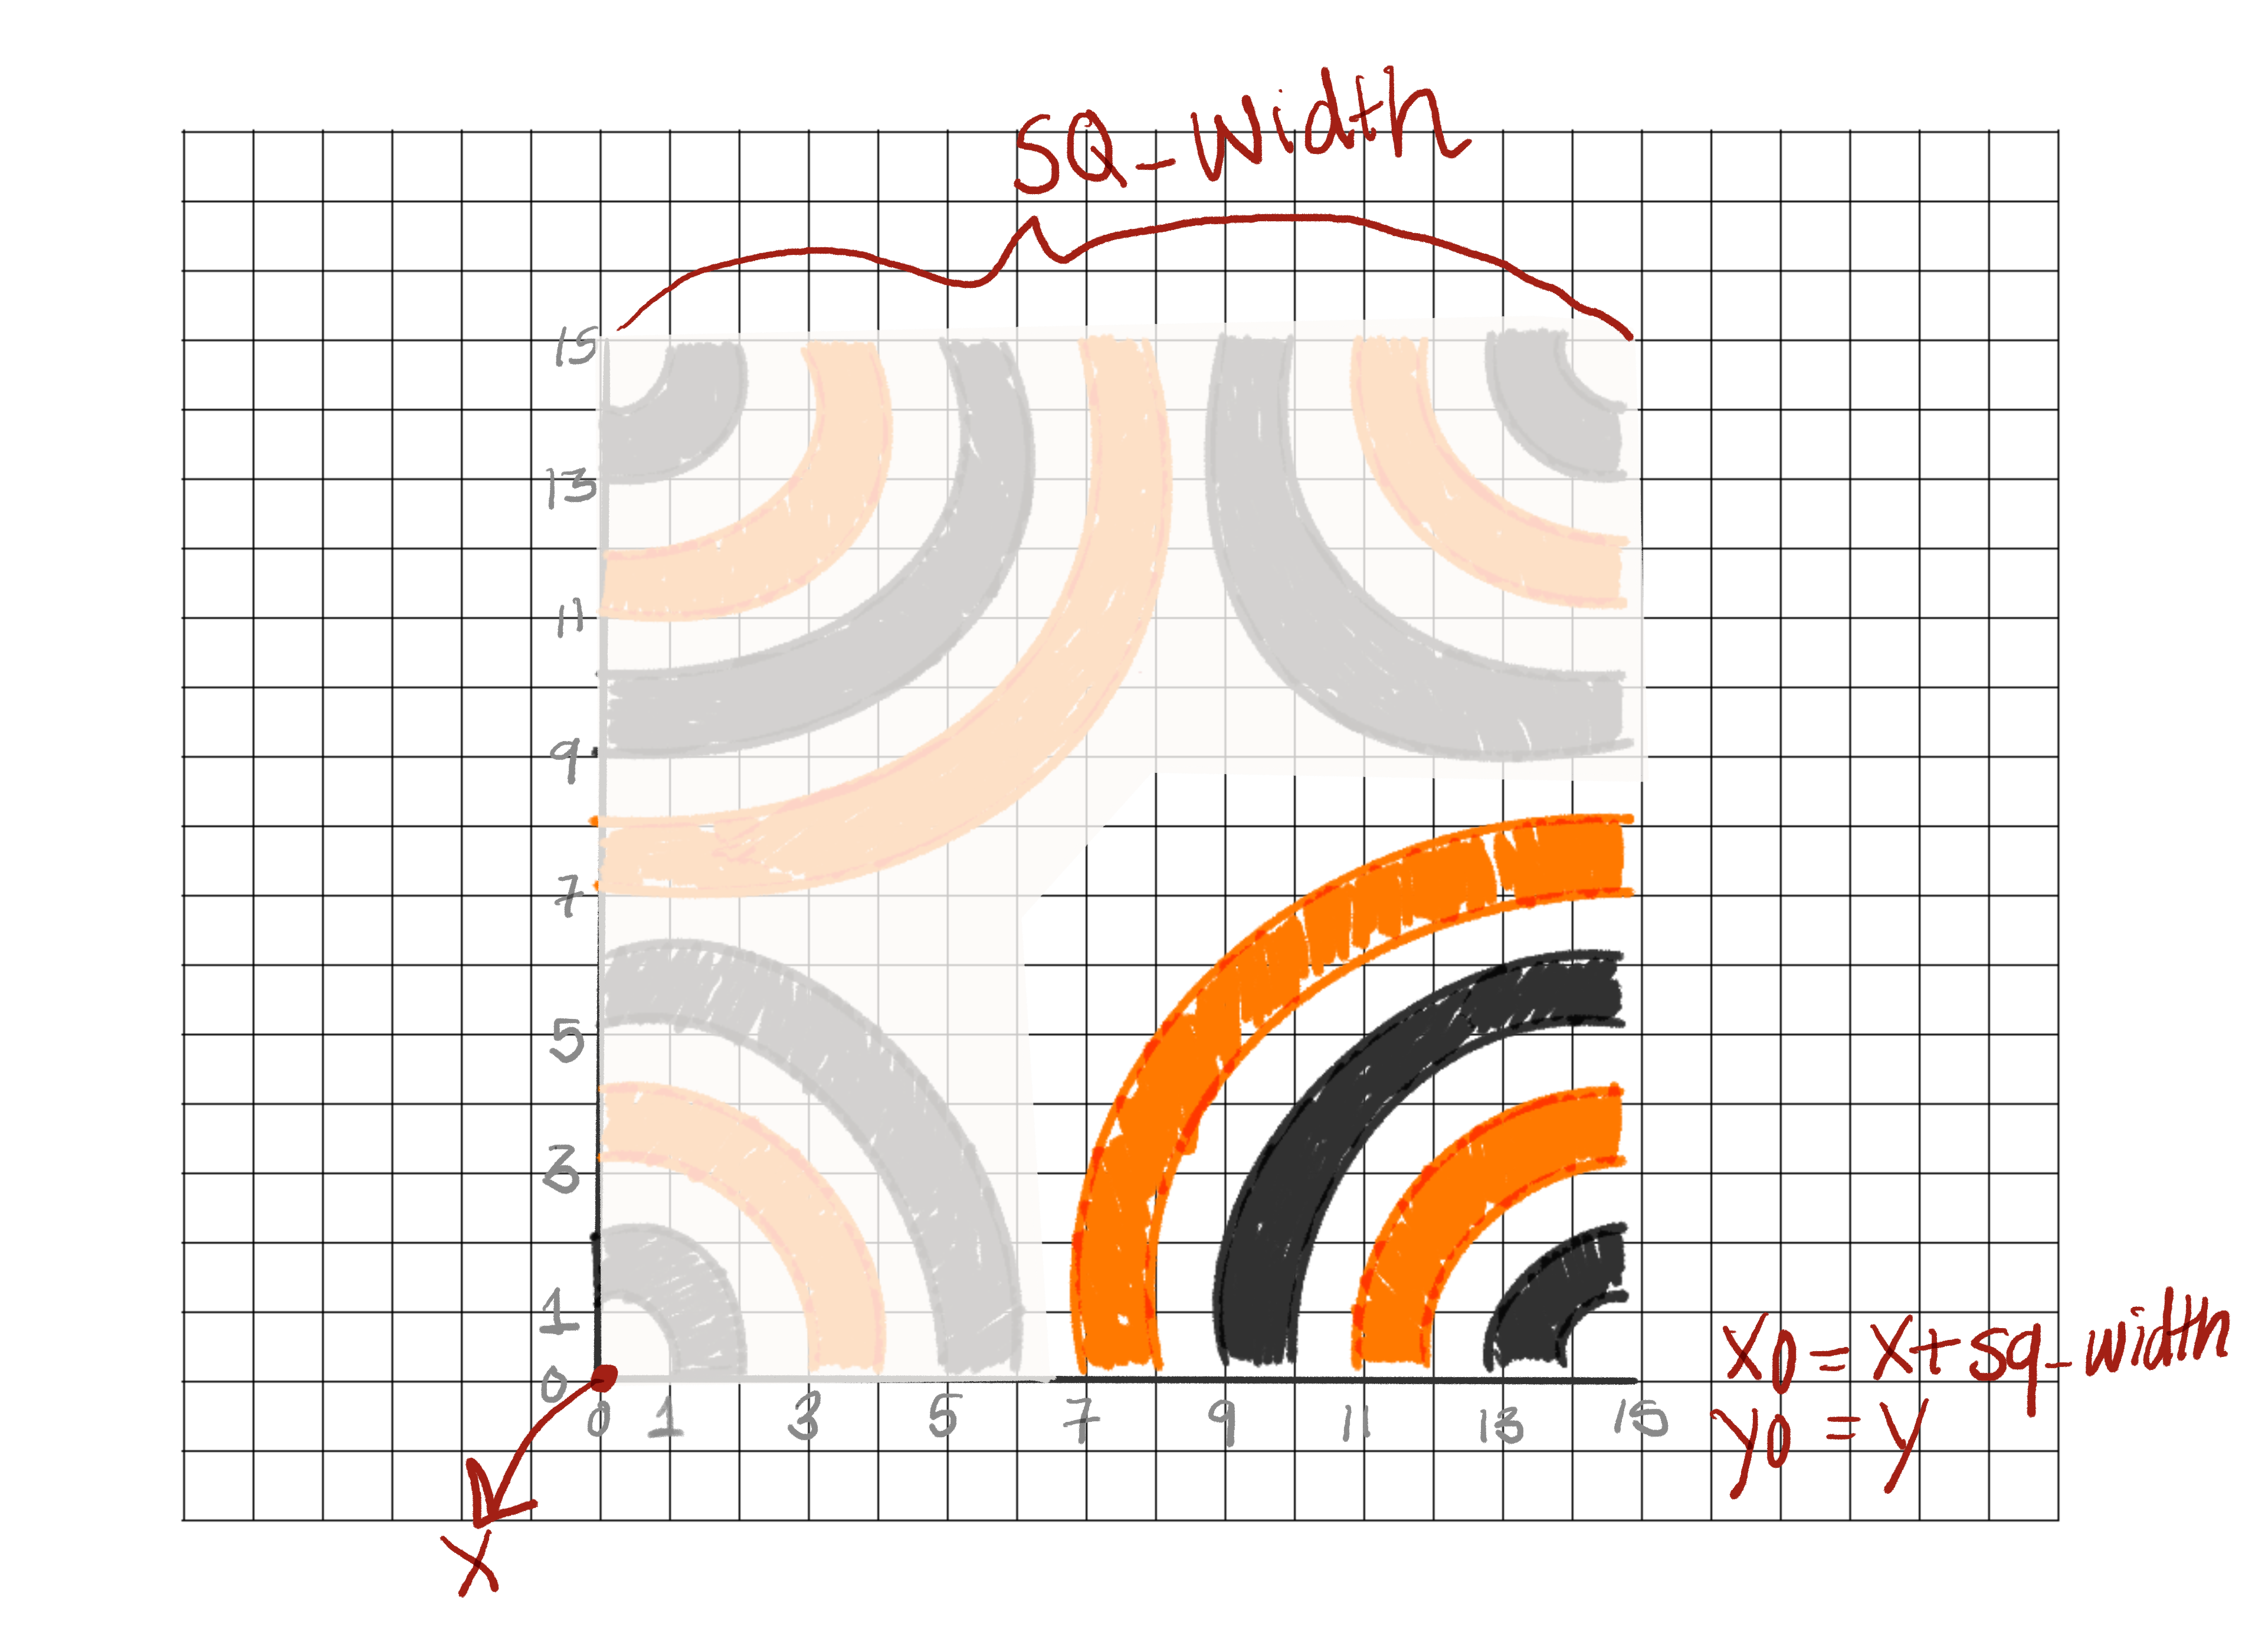
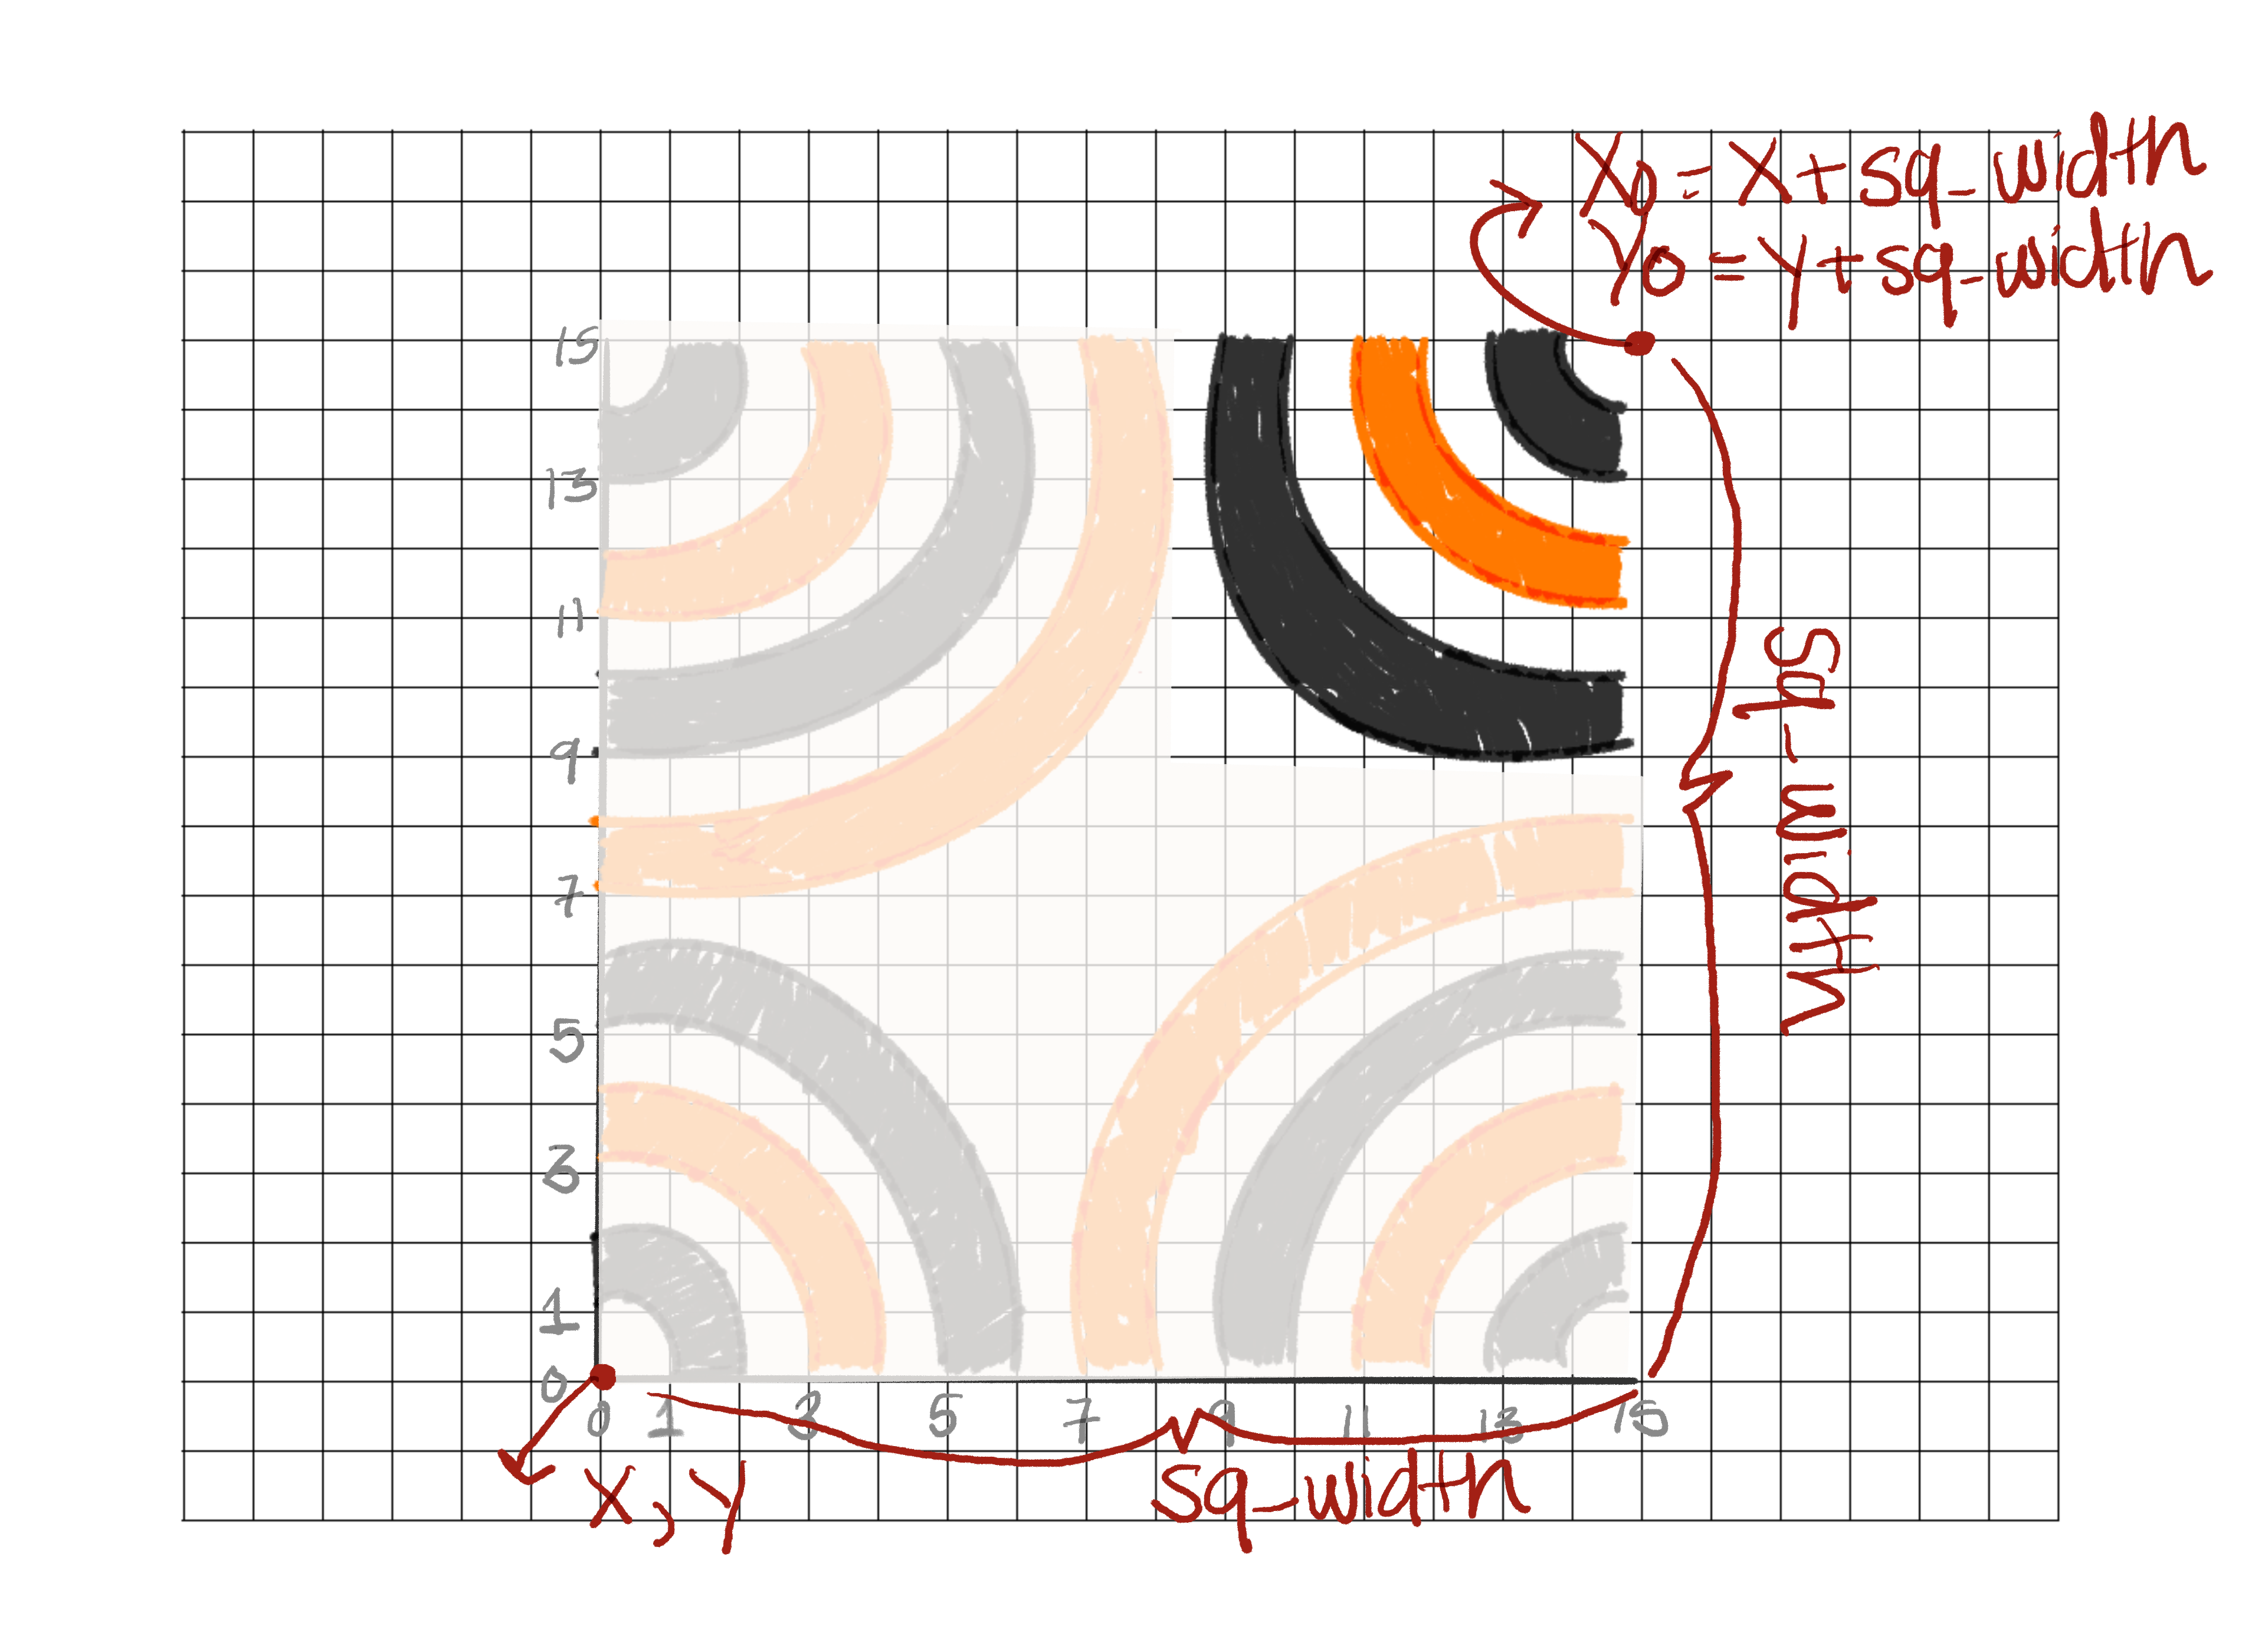
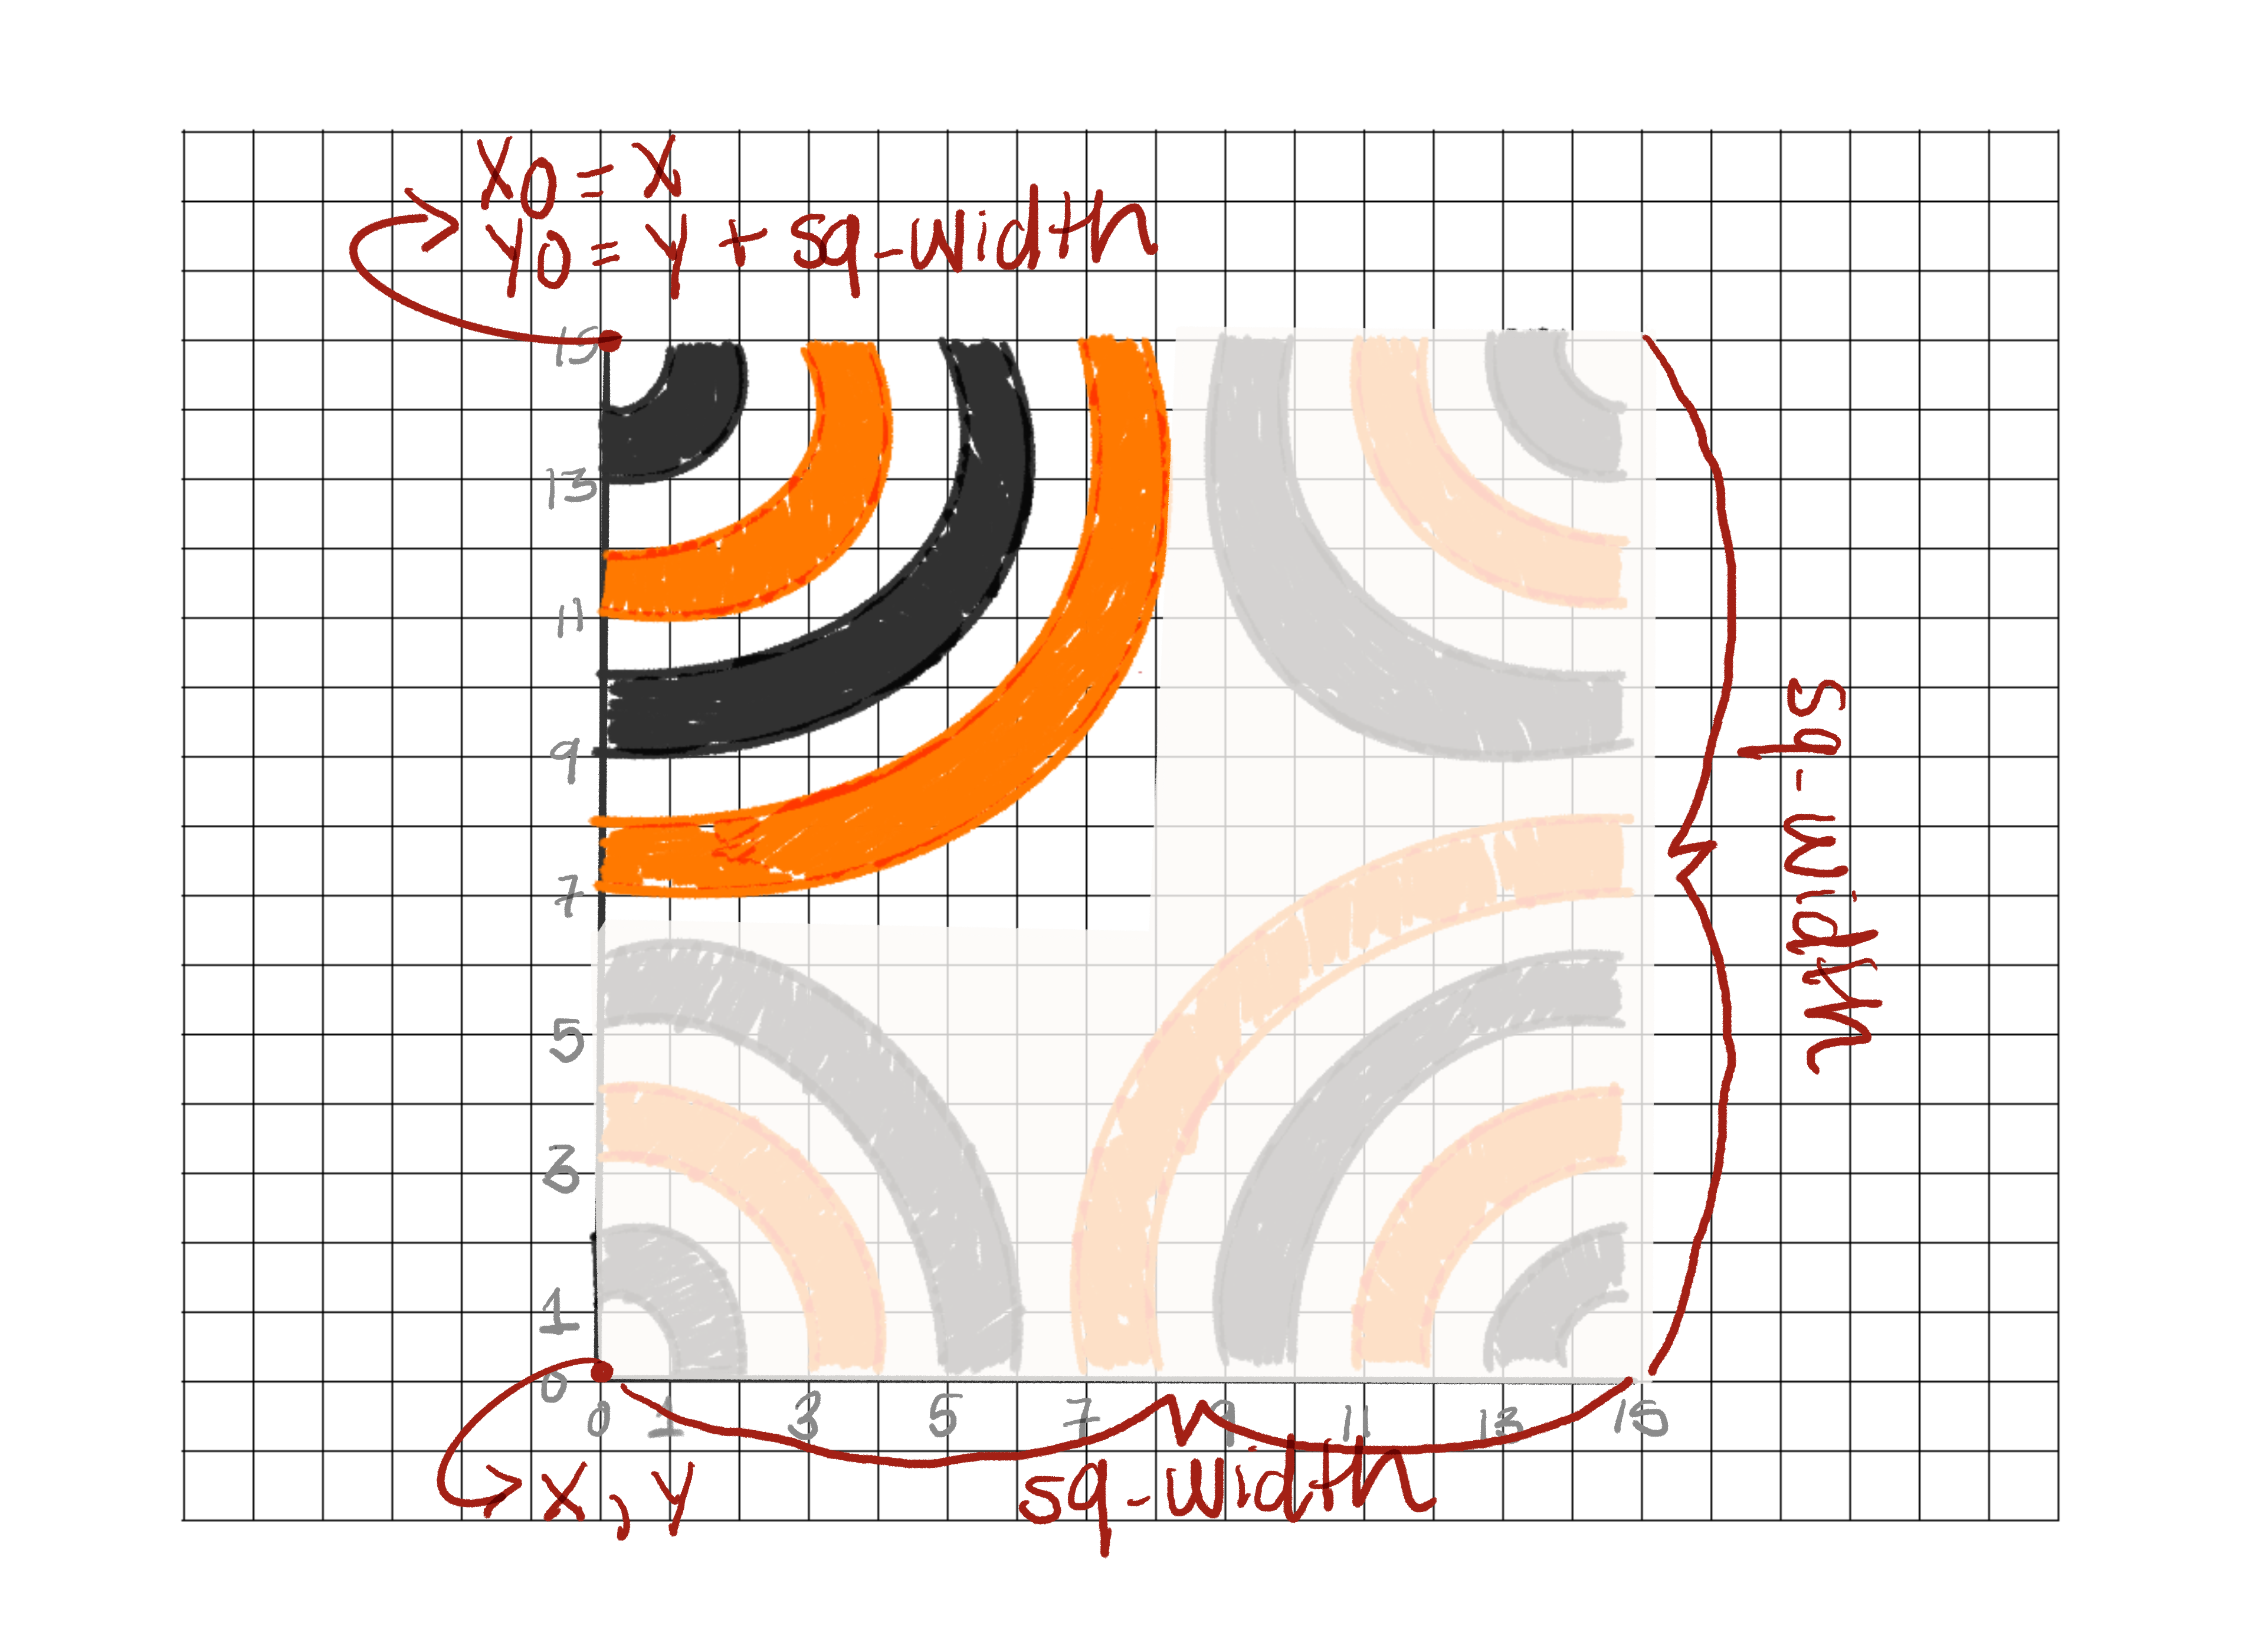
Corner 1: x0, y0
Corner 1: start, end
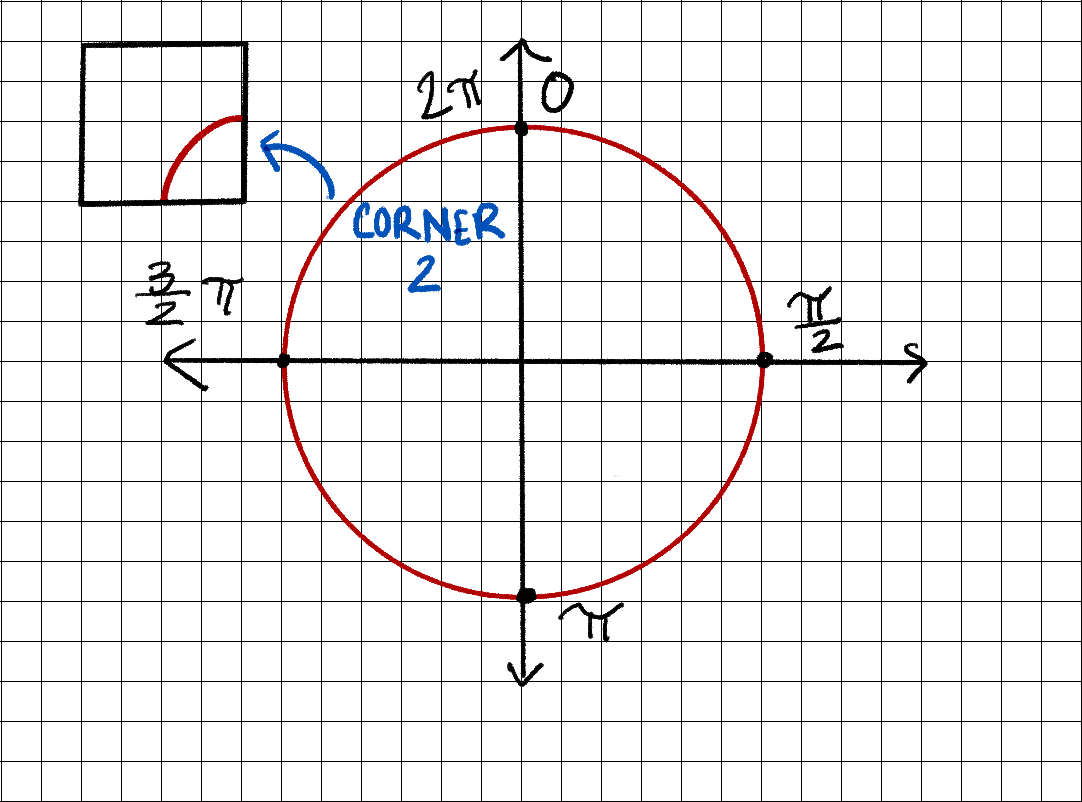
Corner 2
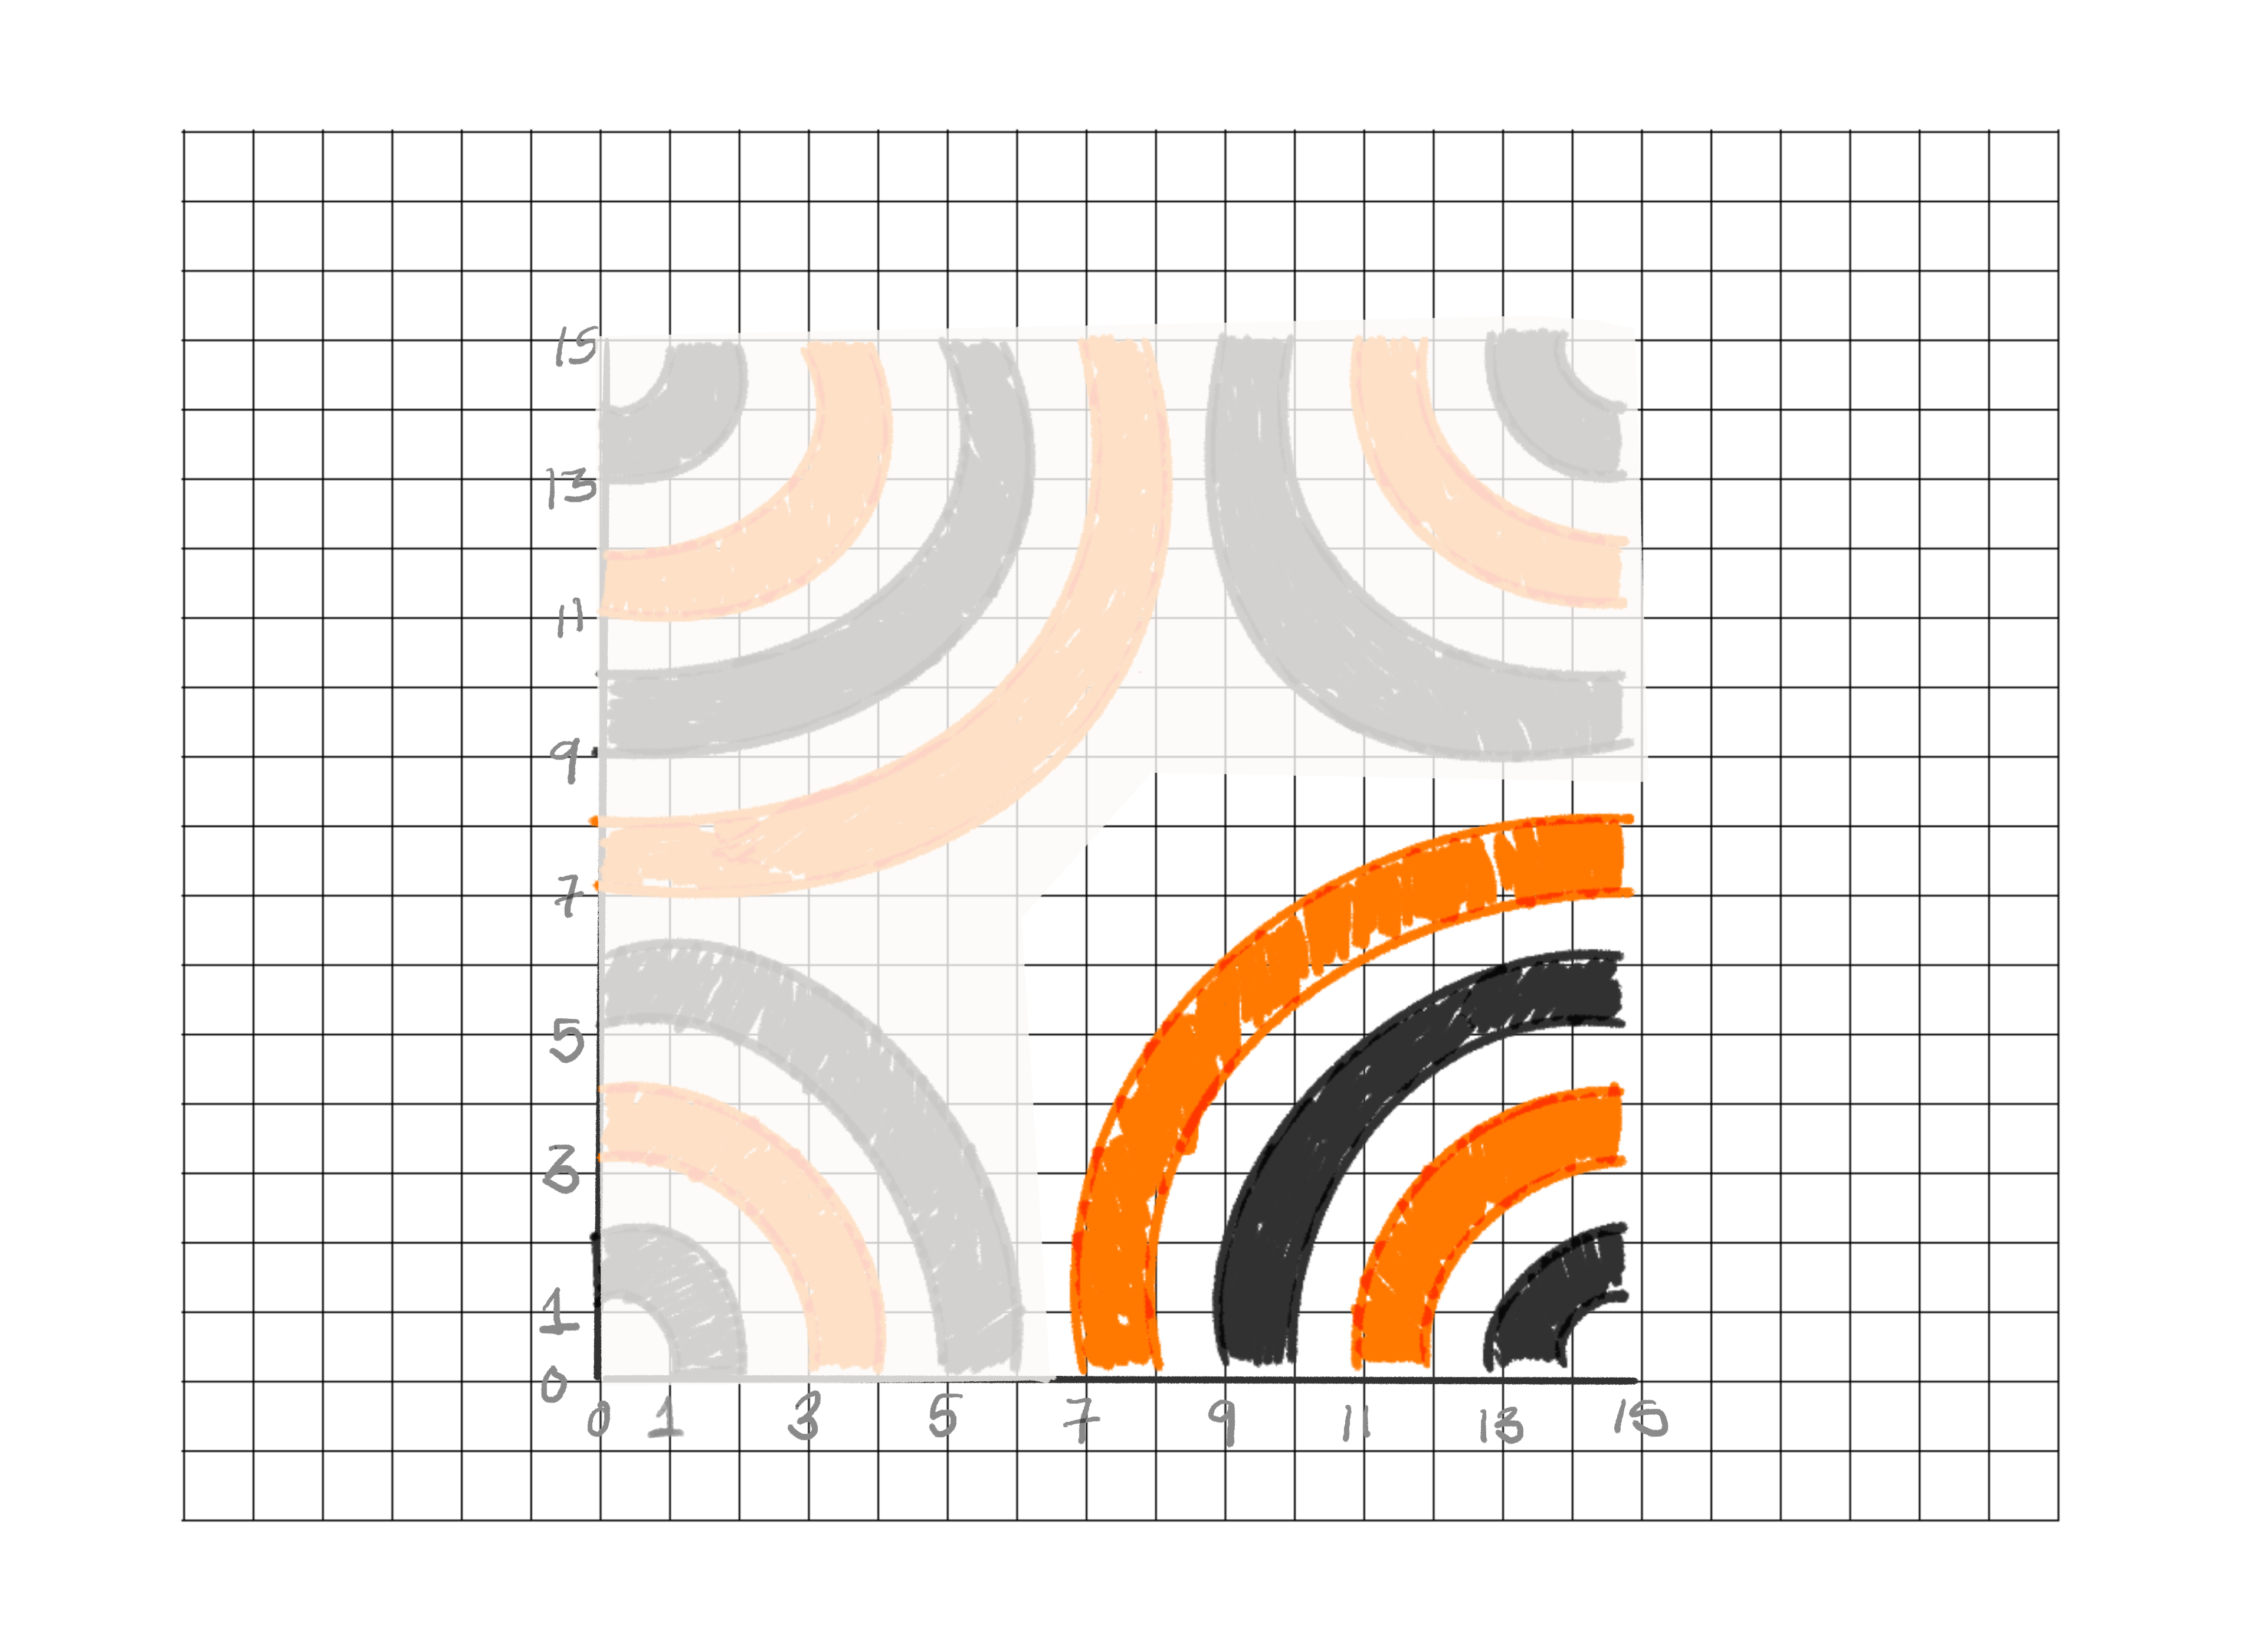
Corner 2: x0, y0
Corner 2: start, end
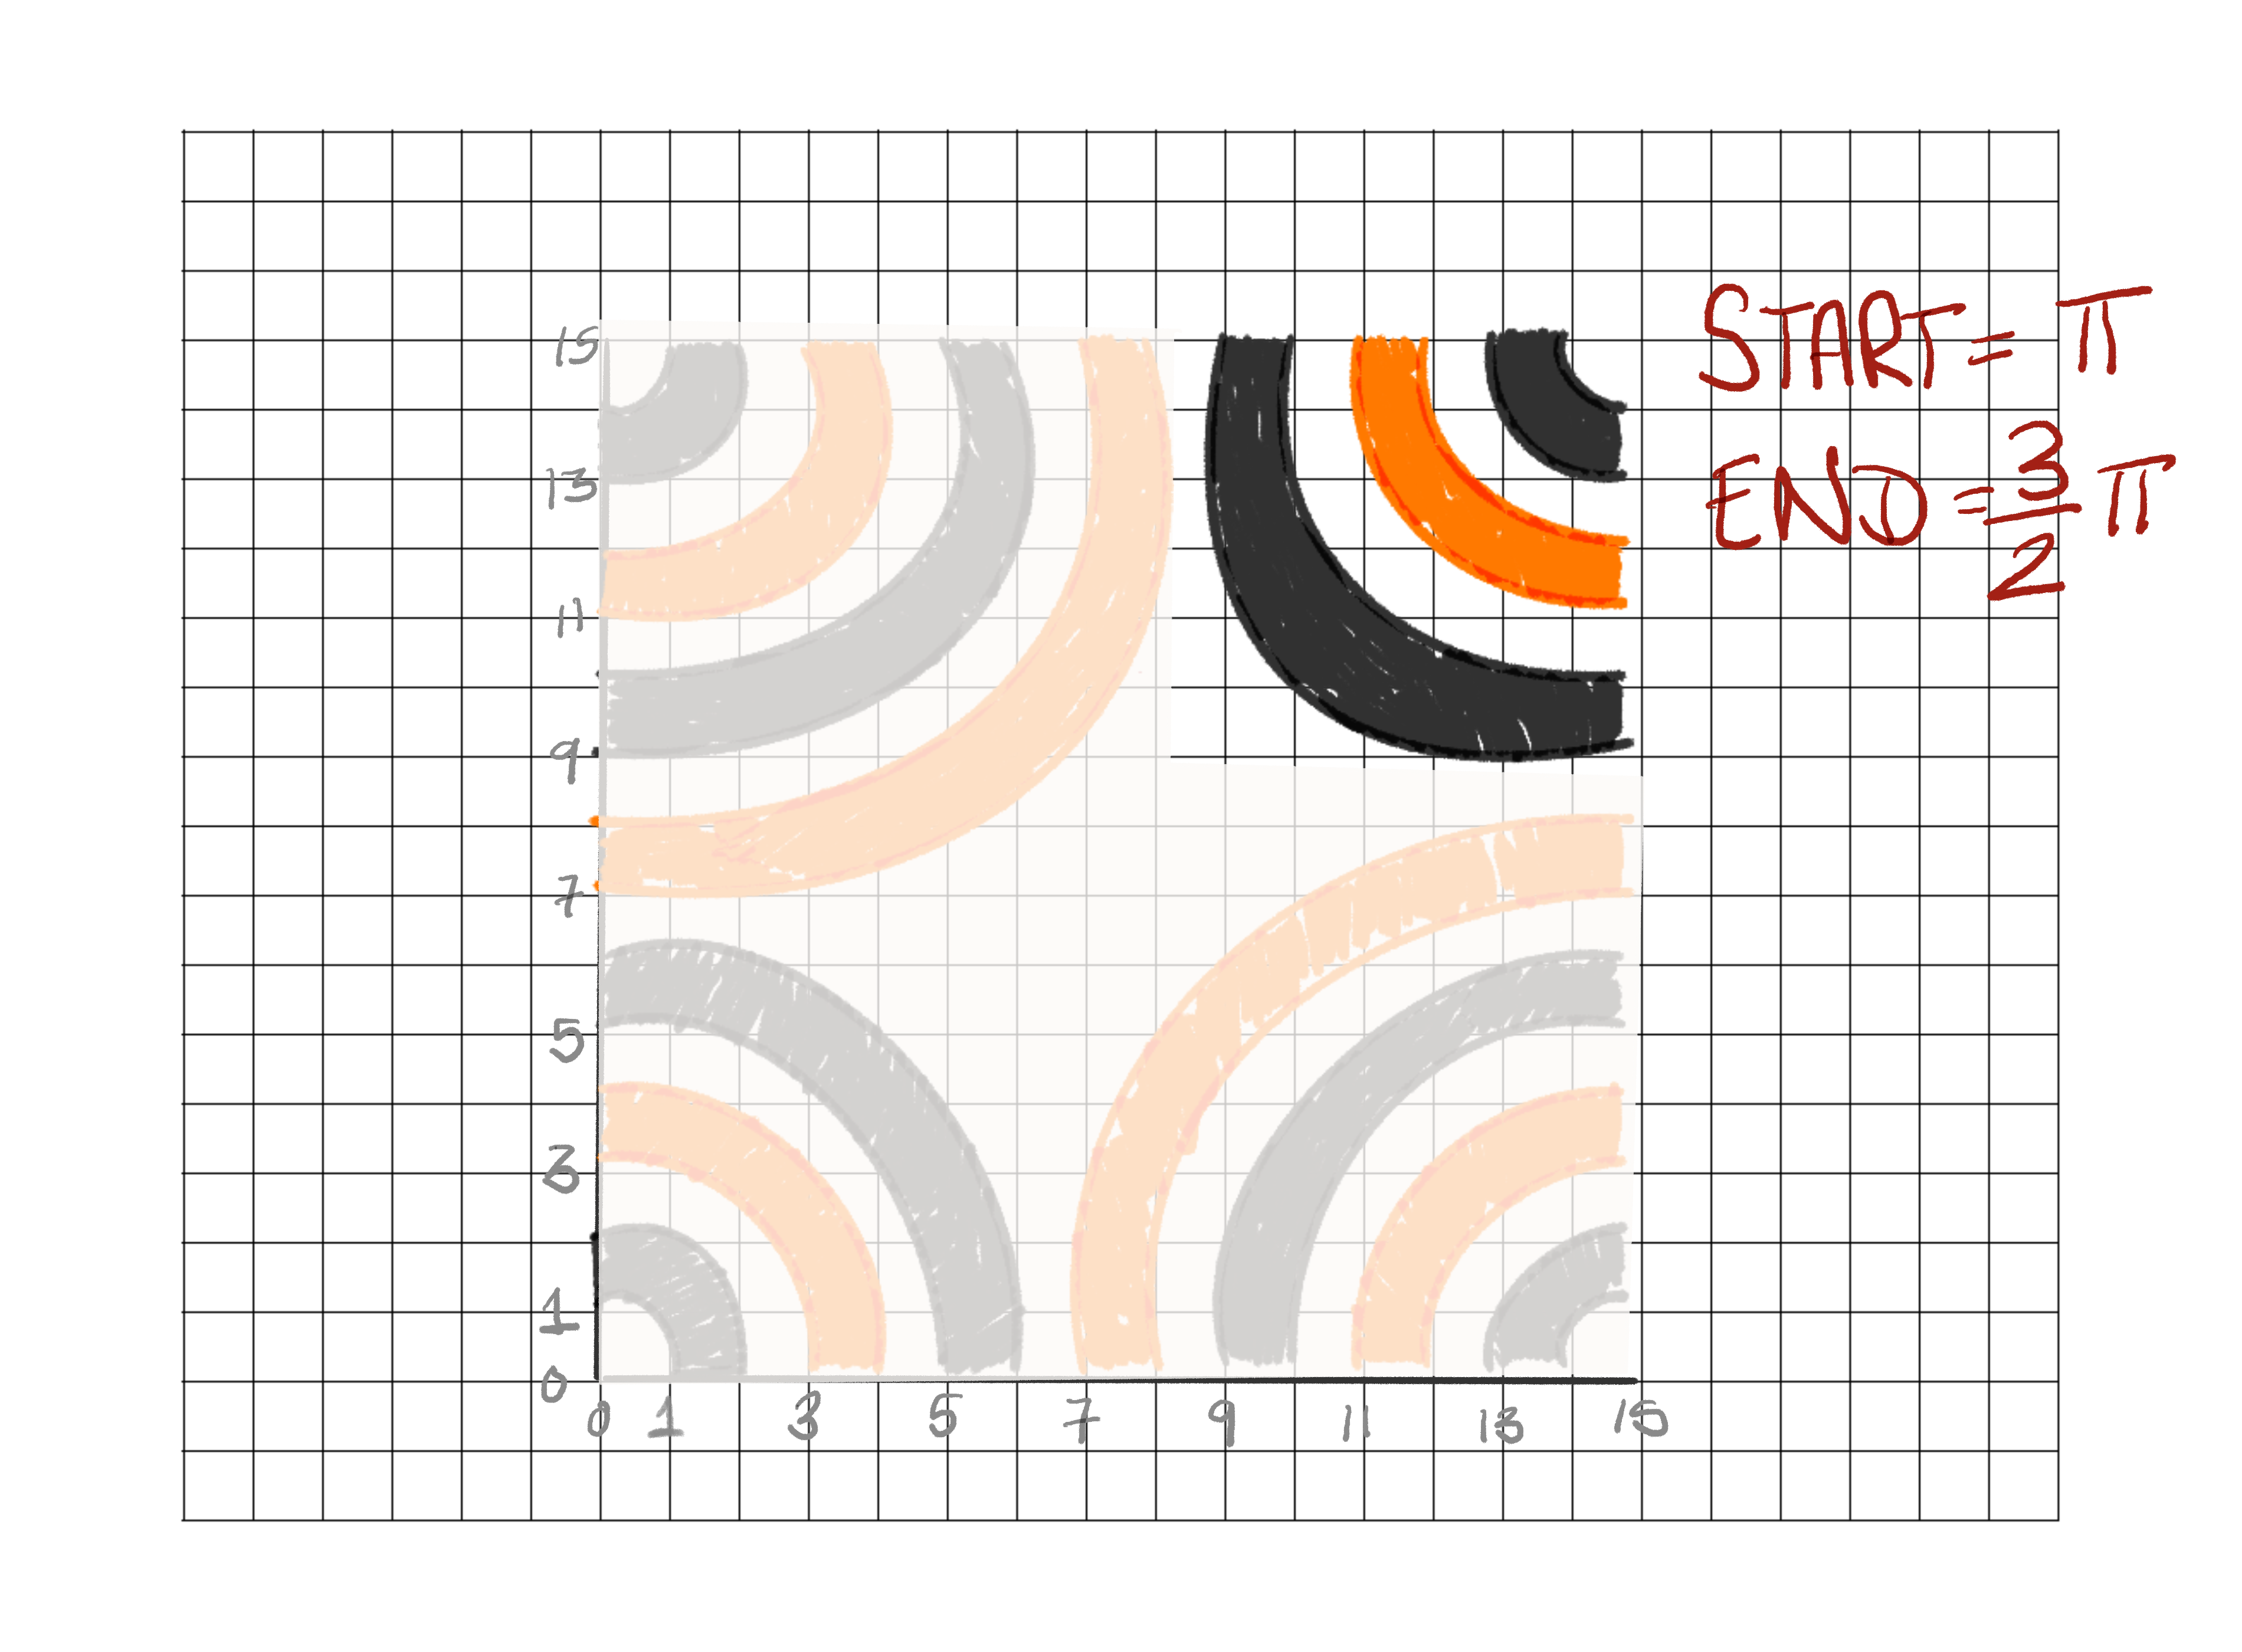
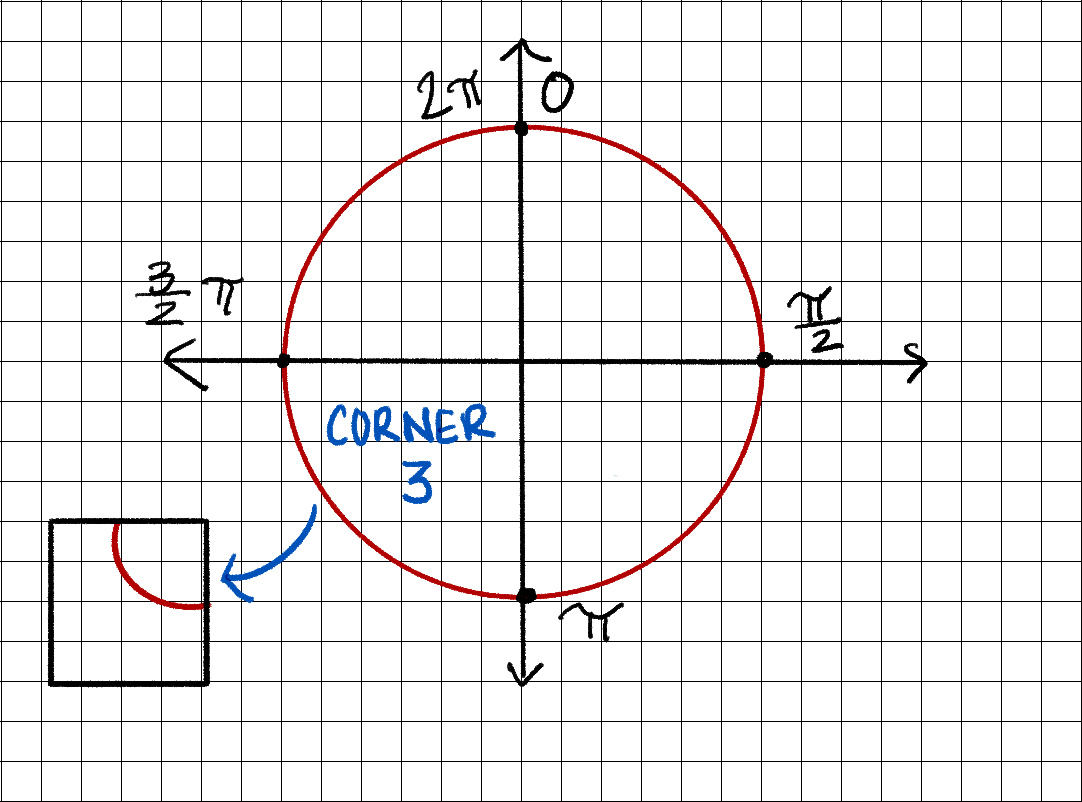
Corner 3
Corner 3: x0, y0
Corner 3: start, end
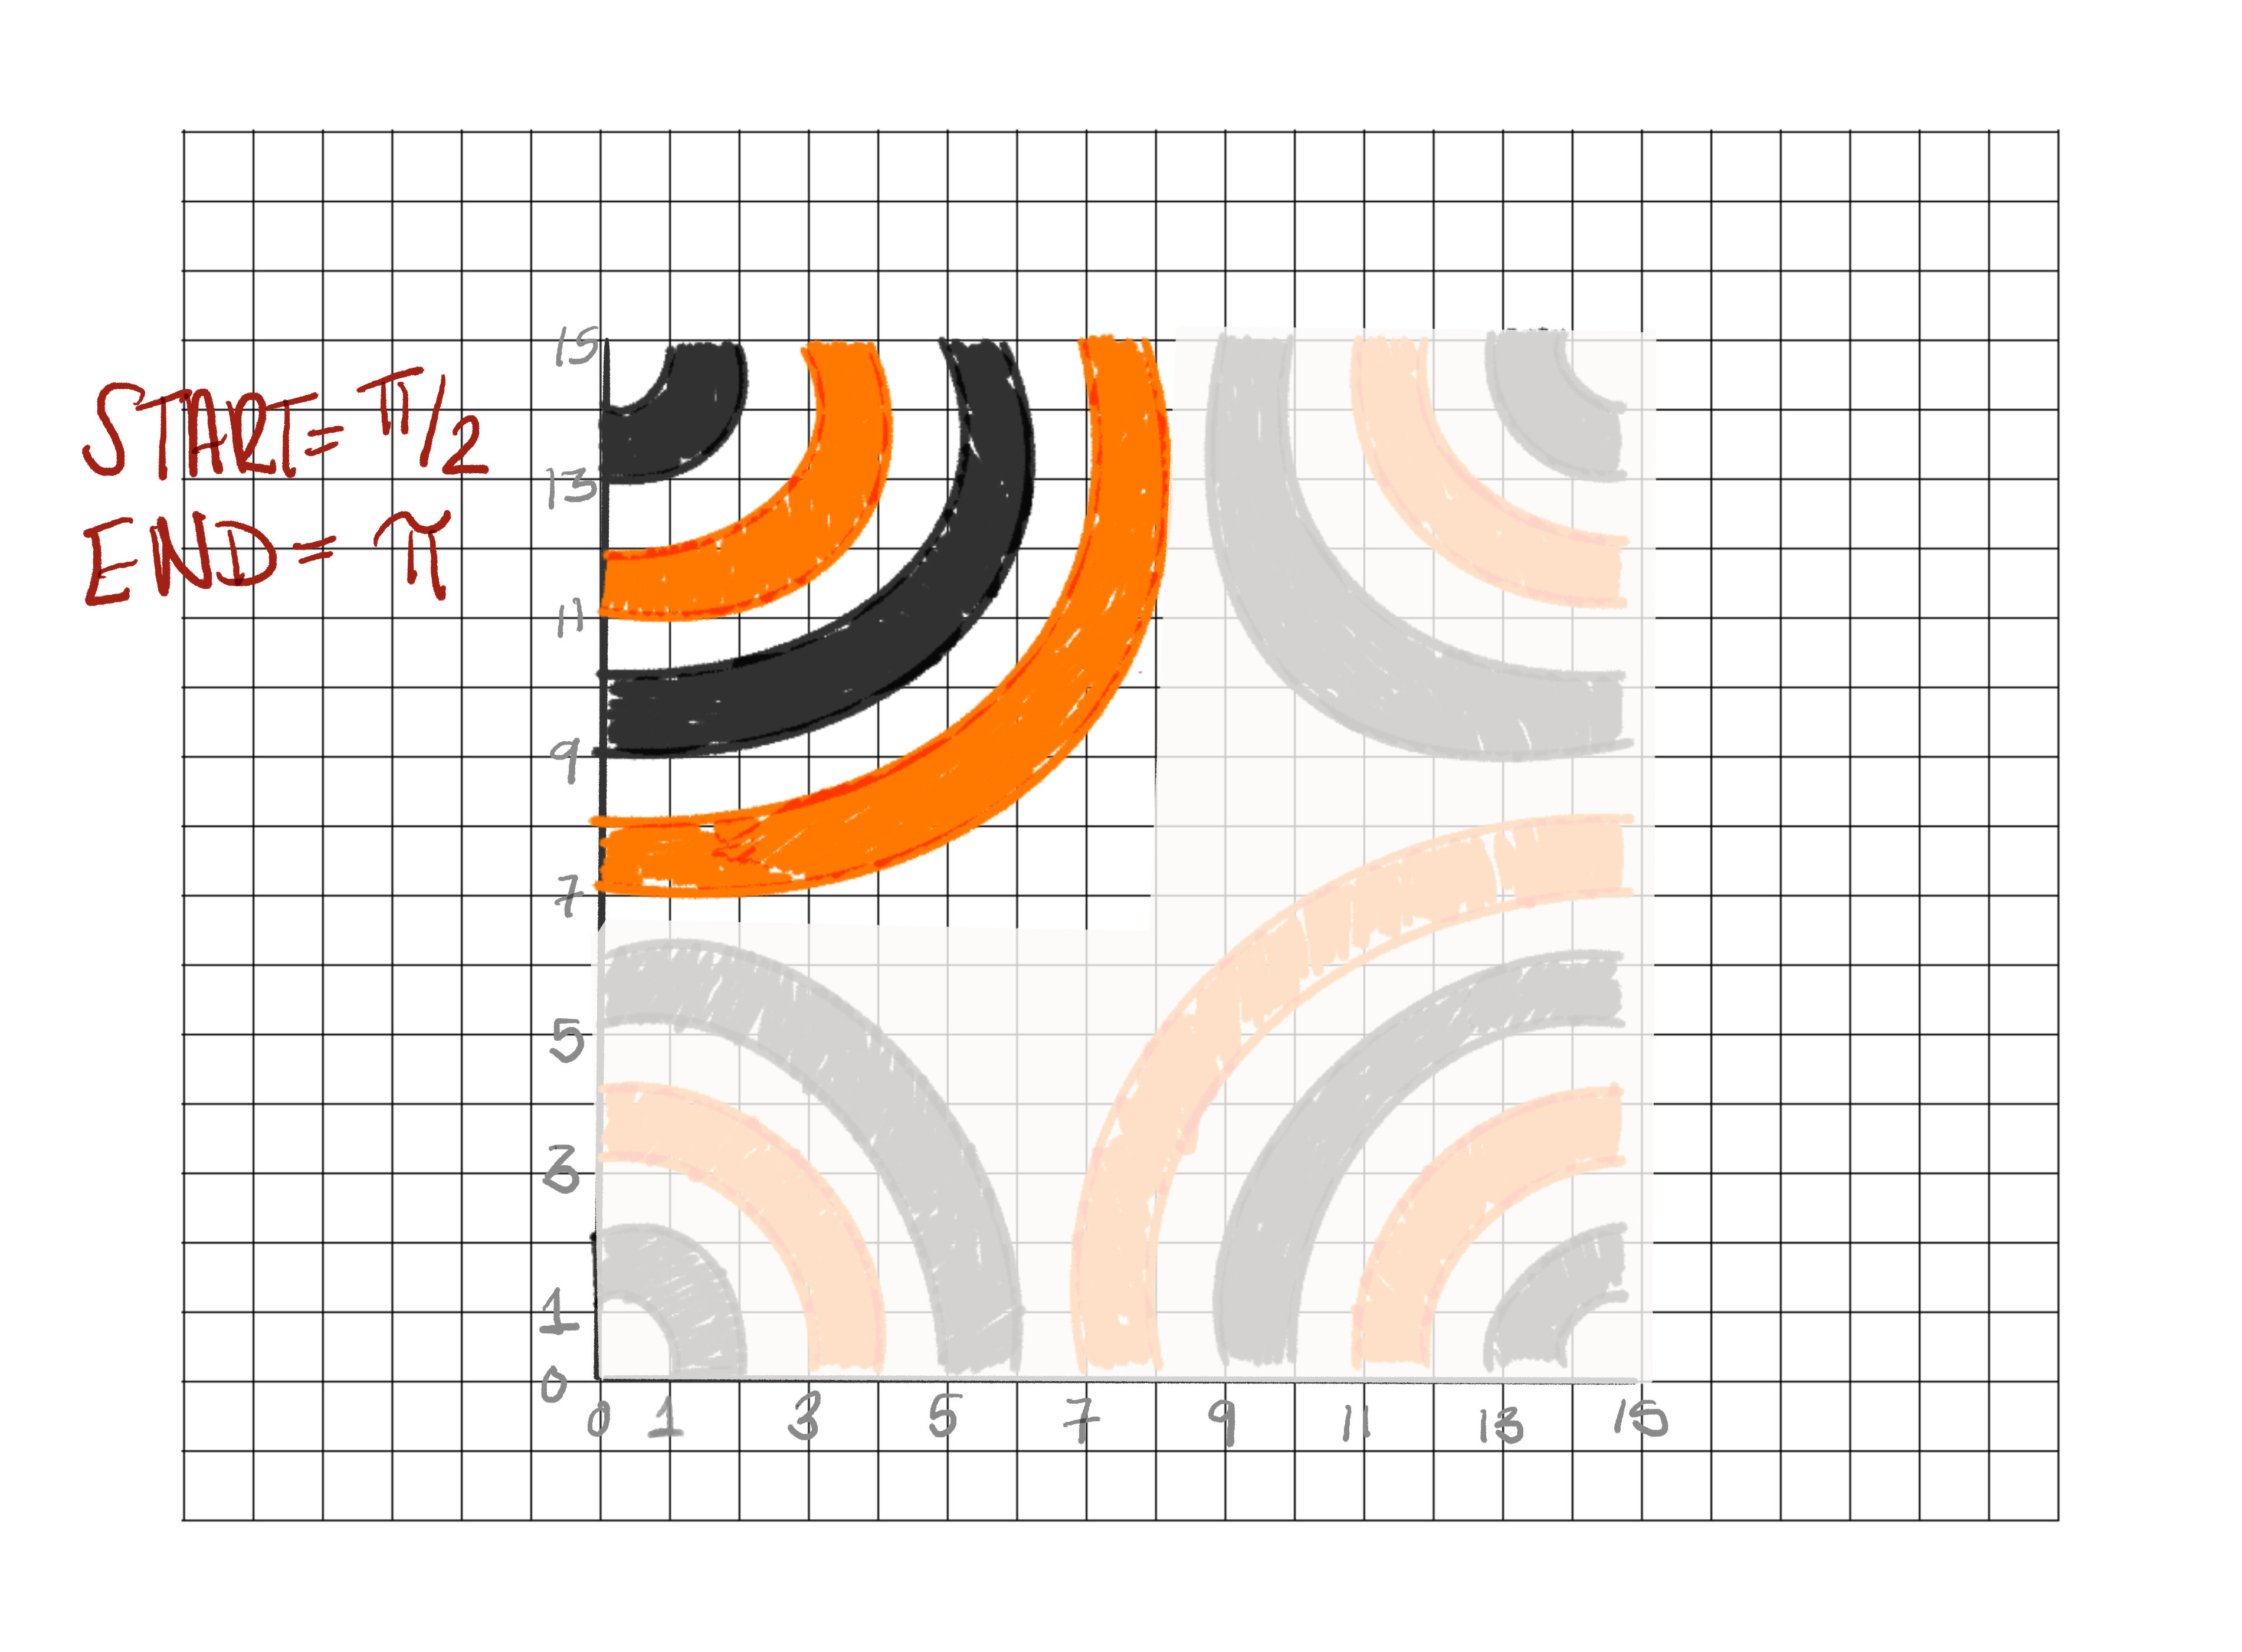
Corner 4
Corner 4: x0, y0
Corner 4: start, end
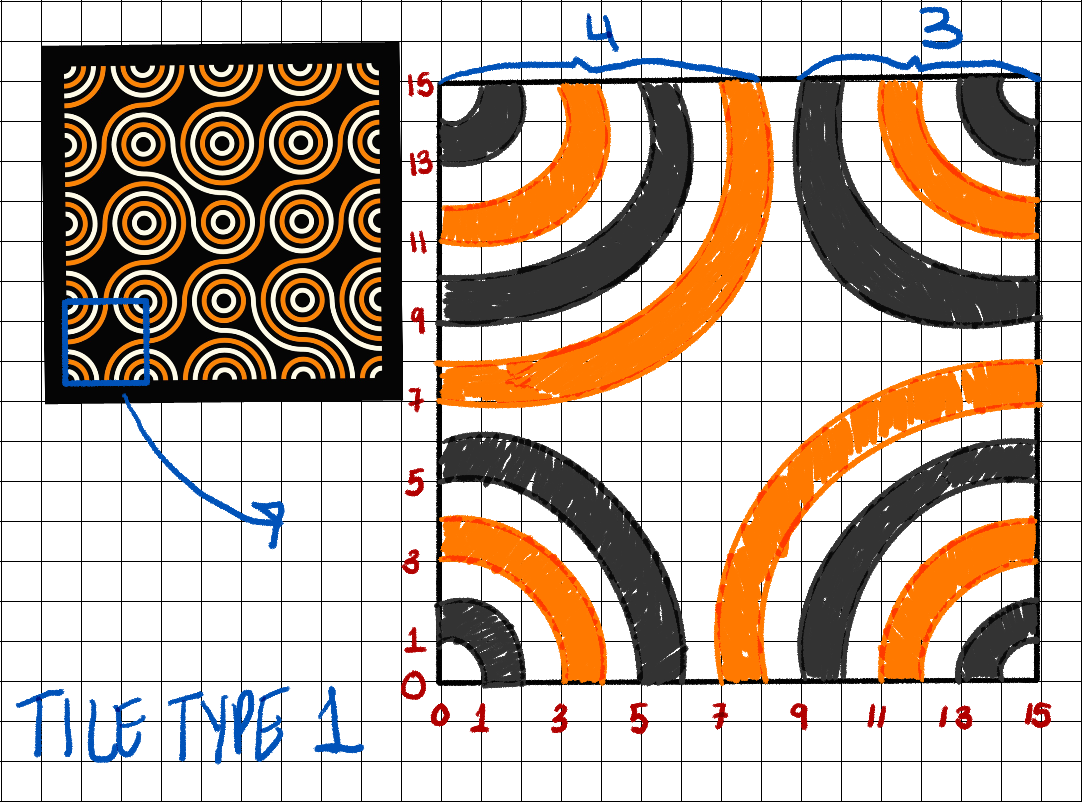
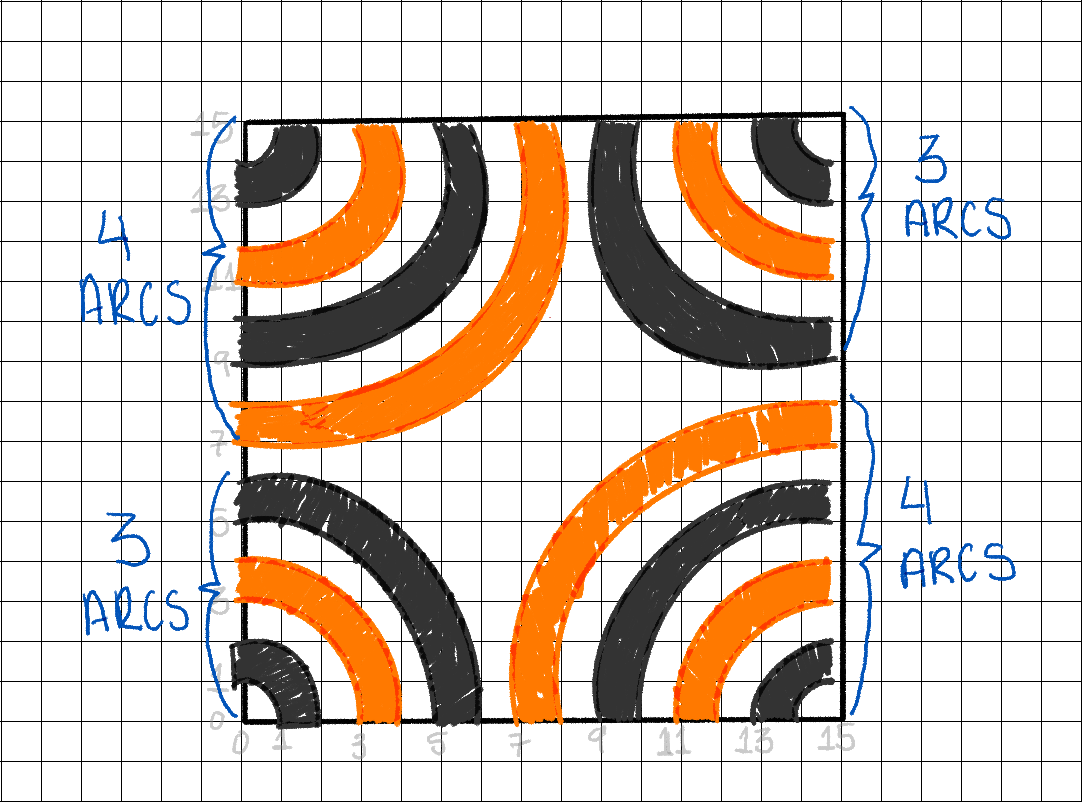
Number of Arcs
Tile Type 1
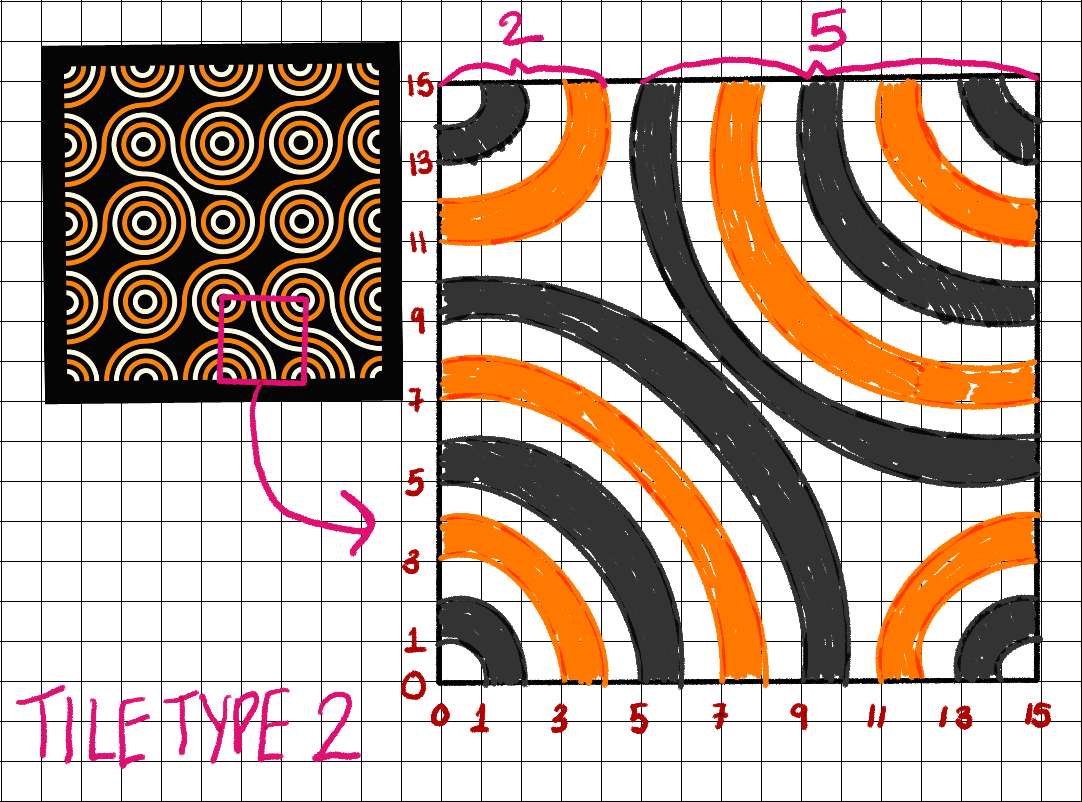
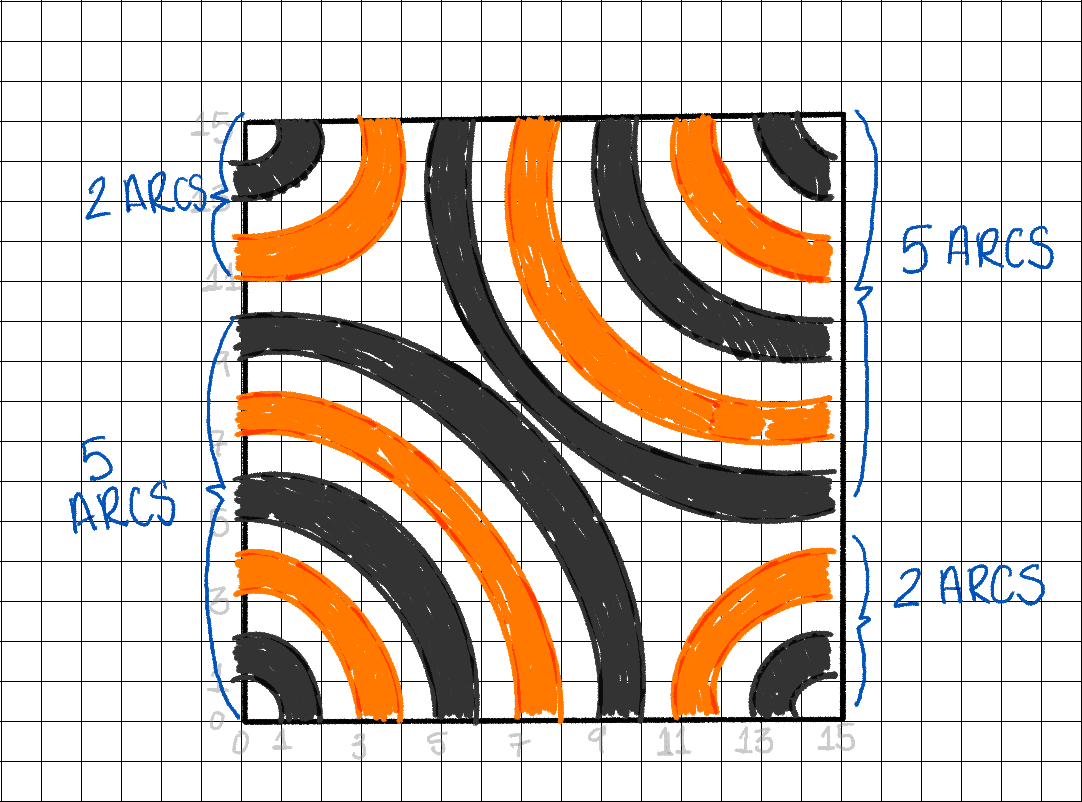
Tile Type 2
Update set_params()
Number of Arcs
🔔 start bottom left, travel counter clockwise!
Tile Type 1
Update set_params()
Number of Arcs
set_params <-
  function(x, y, sq_width, tile_type) {
    tile <- tribble(
           ~x0,          ~y0,  ~start,    ~end,
             x,            y,       0,    pi/2,
  x + sq_width,            y,  3*pi/2,    2*pi,
  x + sq_width, y + sq_width,      pi,  3*pi/2,
             x, y + sq_width,    pi/2,      pi
  )
    if (tile_type == 1) {
       tile %>%
        mutate(num_arcs = c(3, 4, 3, 4))
    } else if (tile_type == 2) {
      tile %>%
        mutate(num_arcs = c(5, 2, 5, 2))
    }
  }
🔔 start bottom left, travel counter clockwise!
Tile Type 2
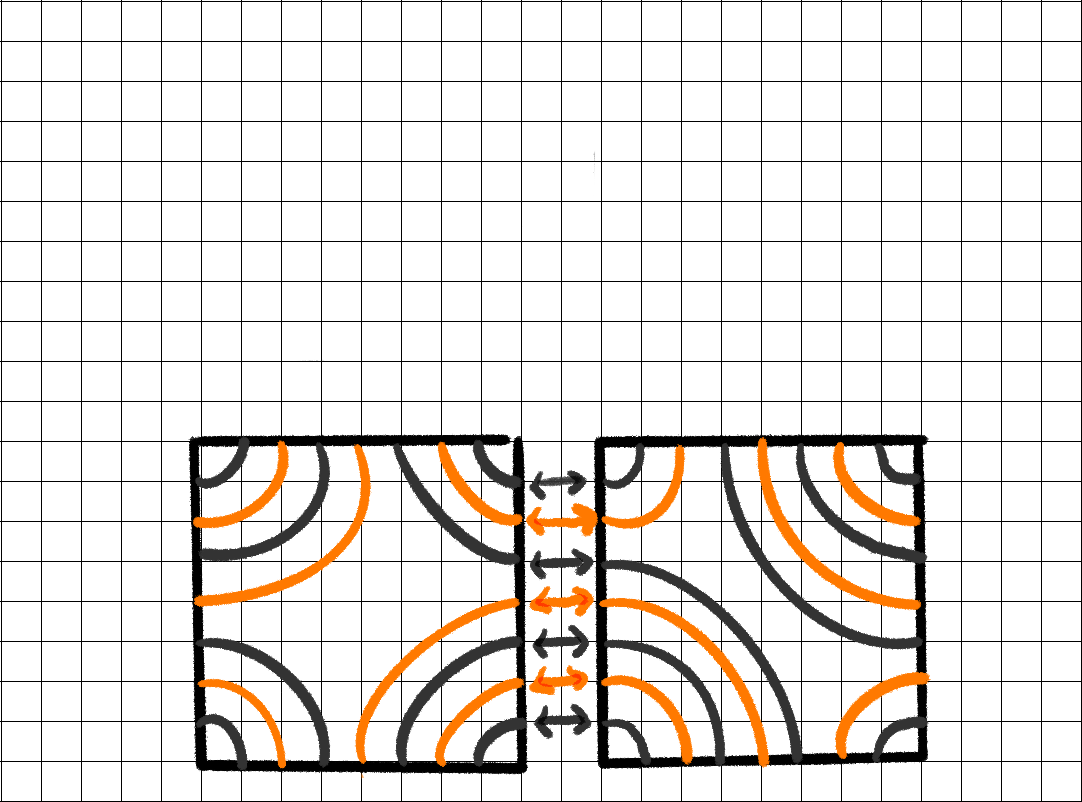
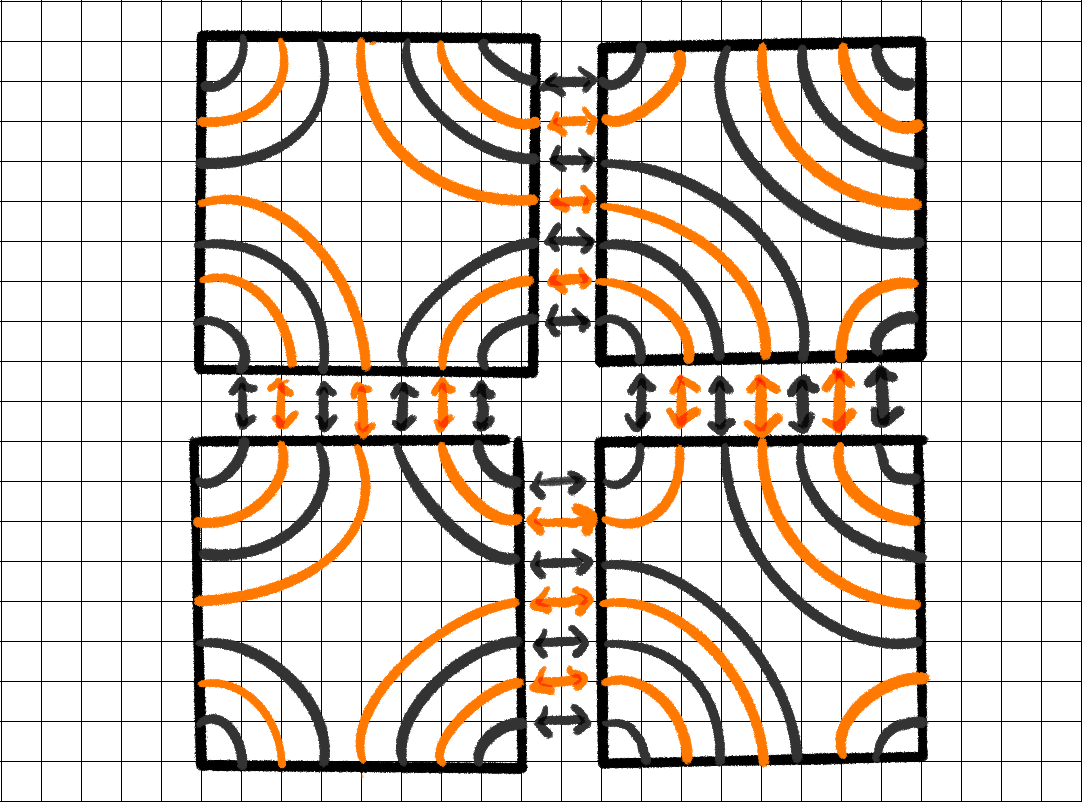
Creating the grid
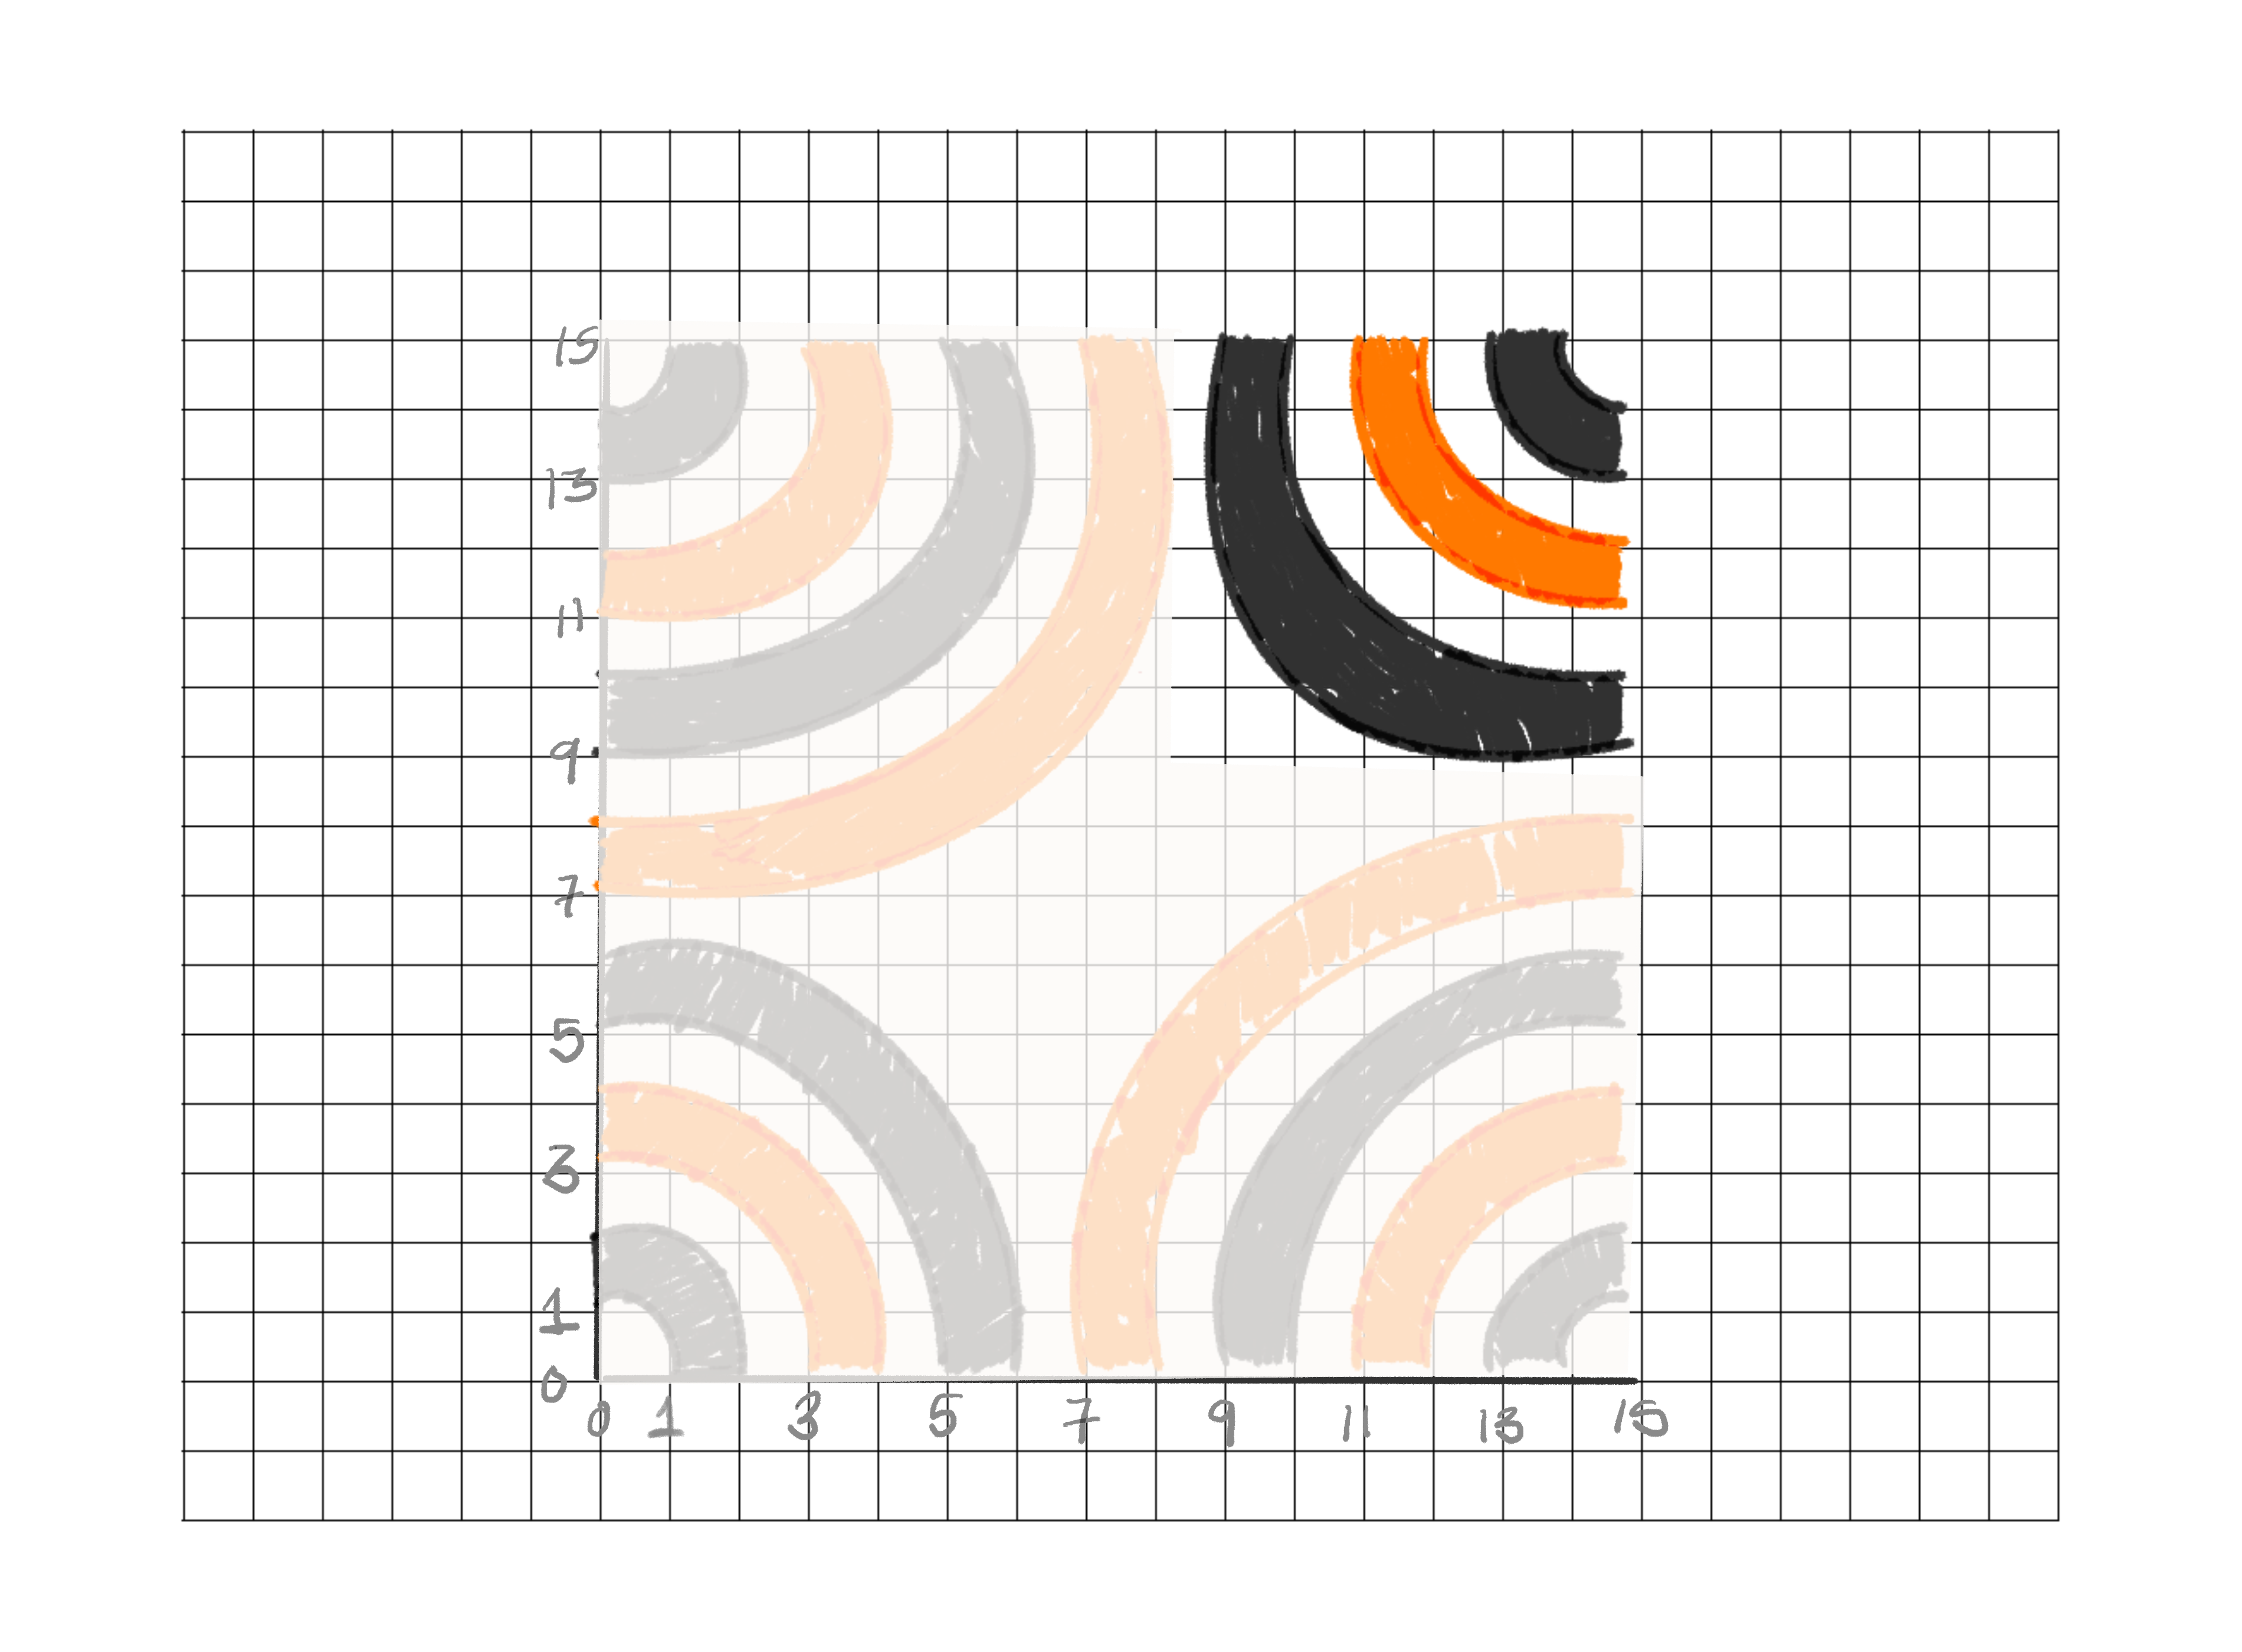
Applying our system
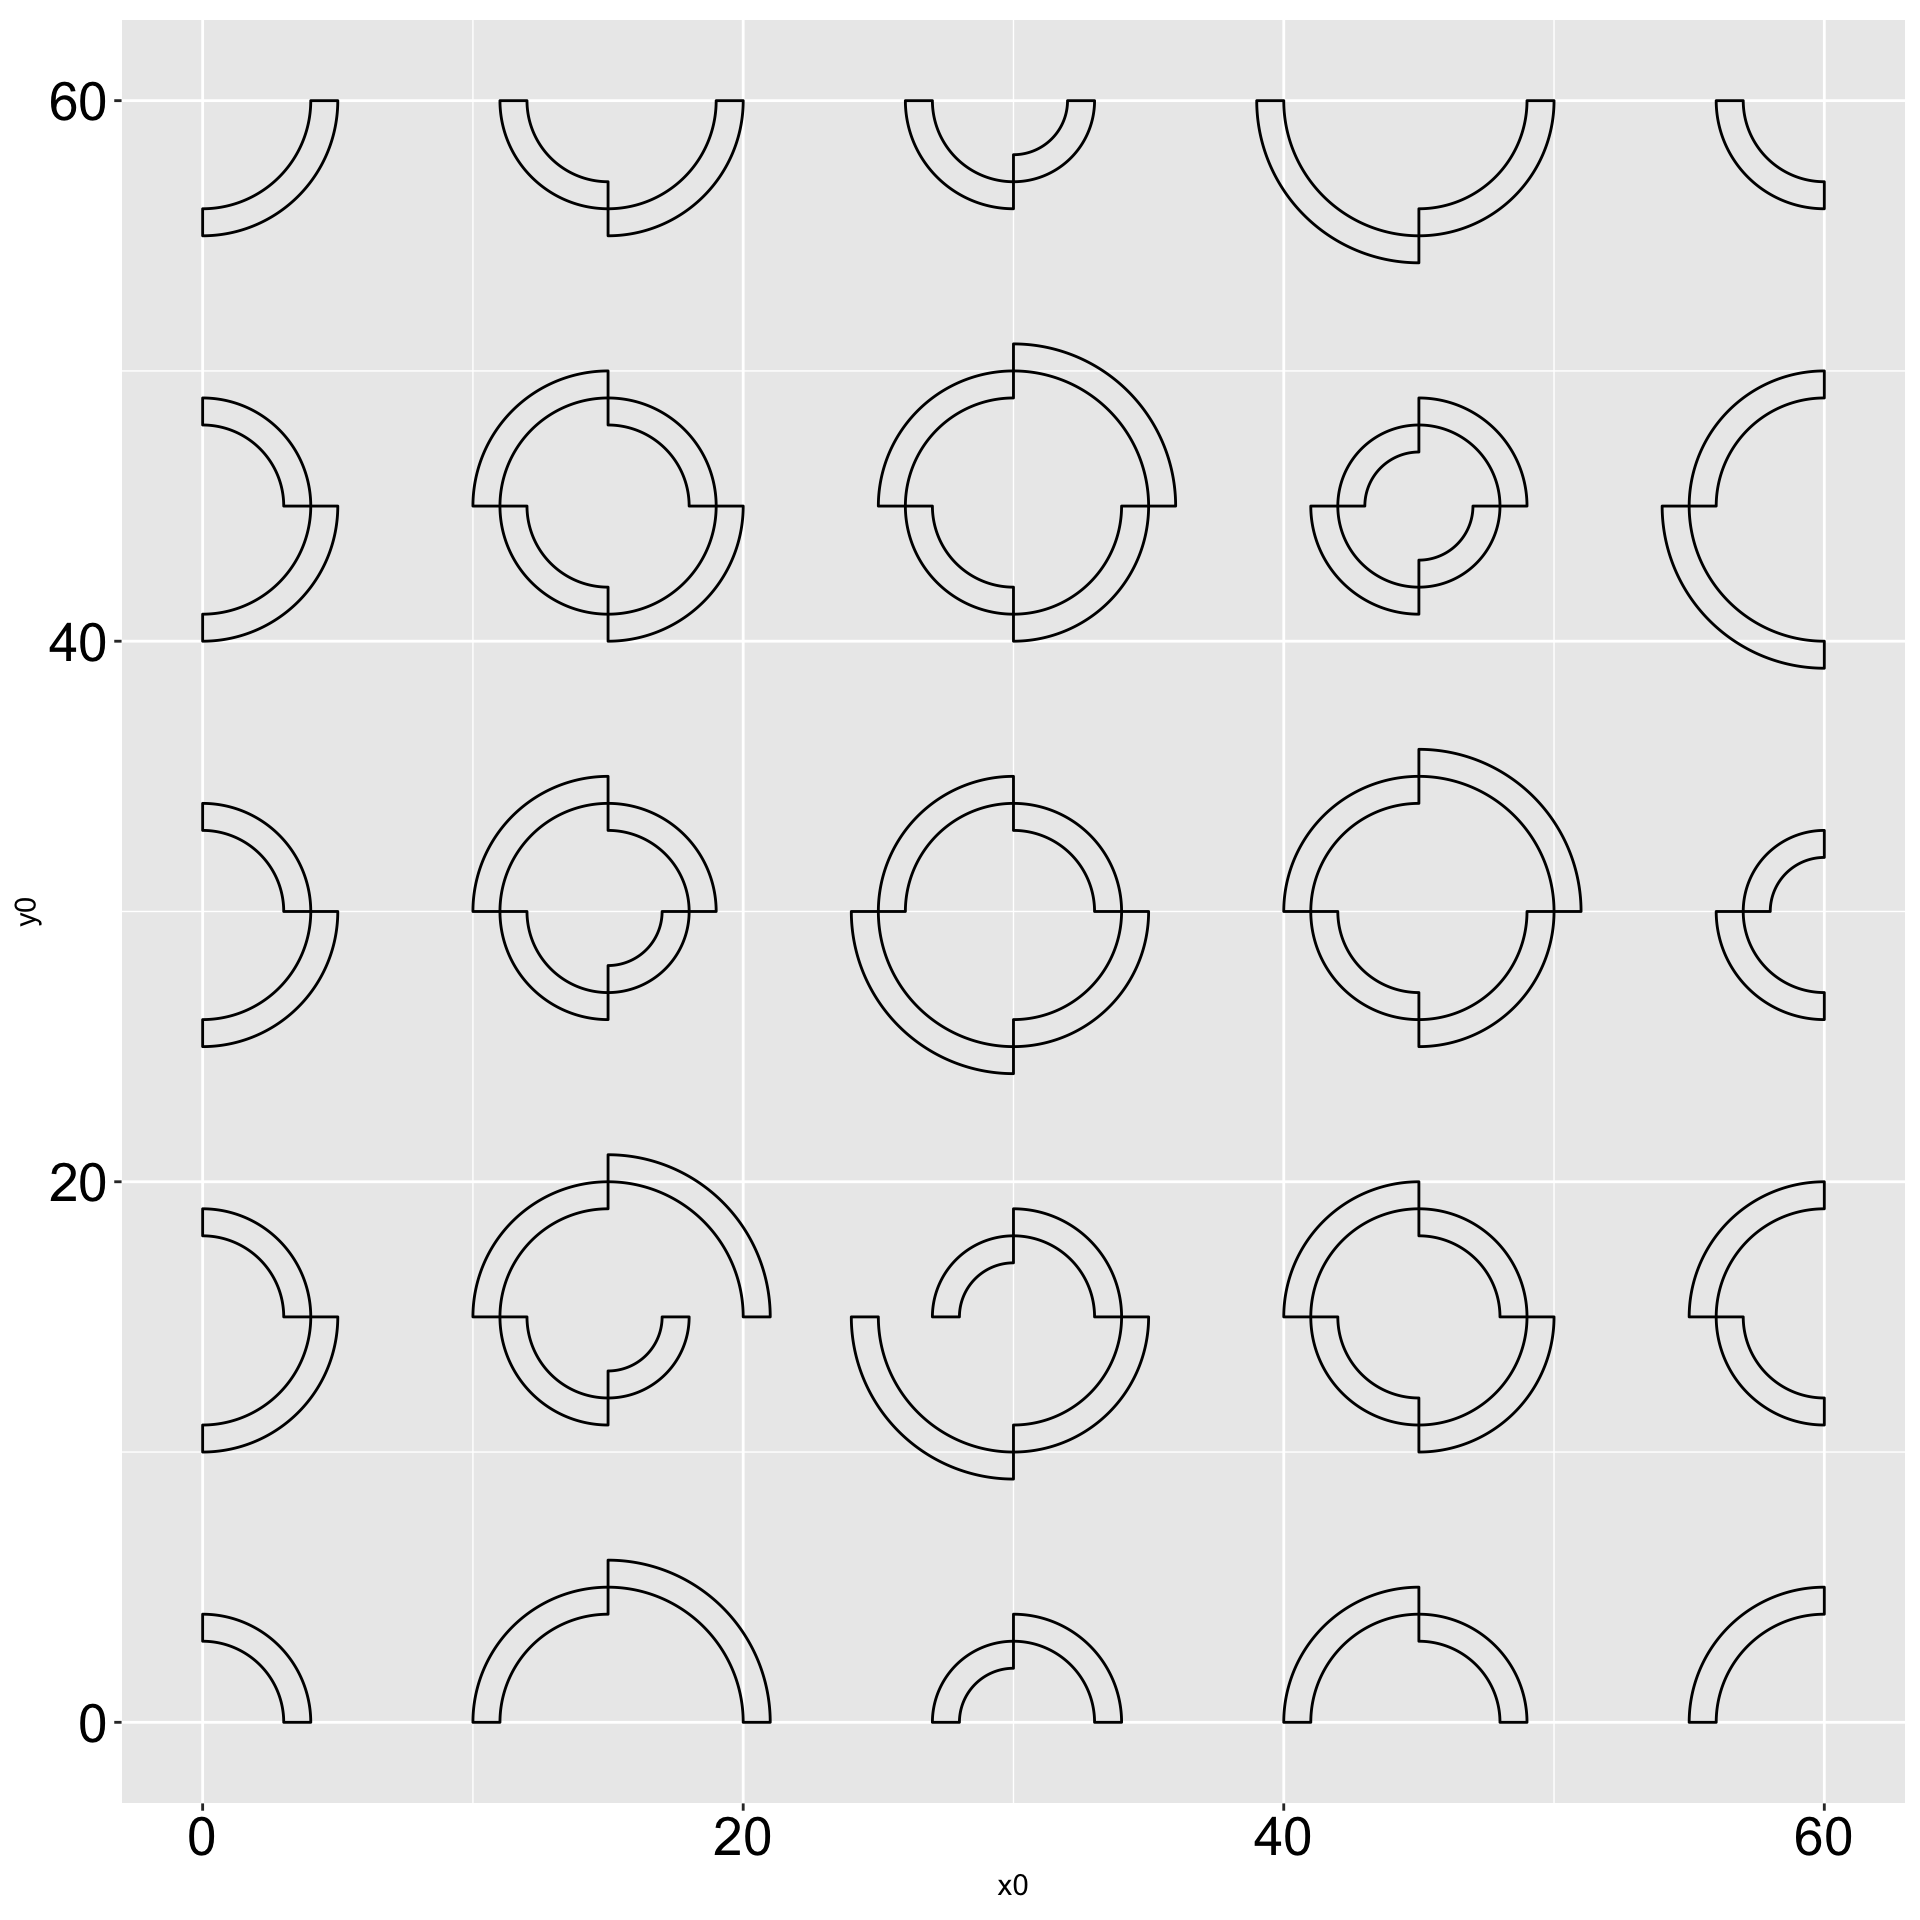
Applying our system
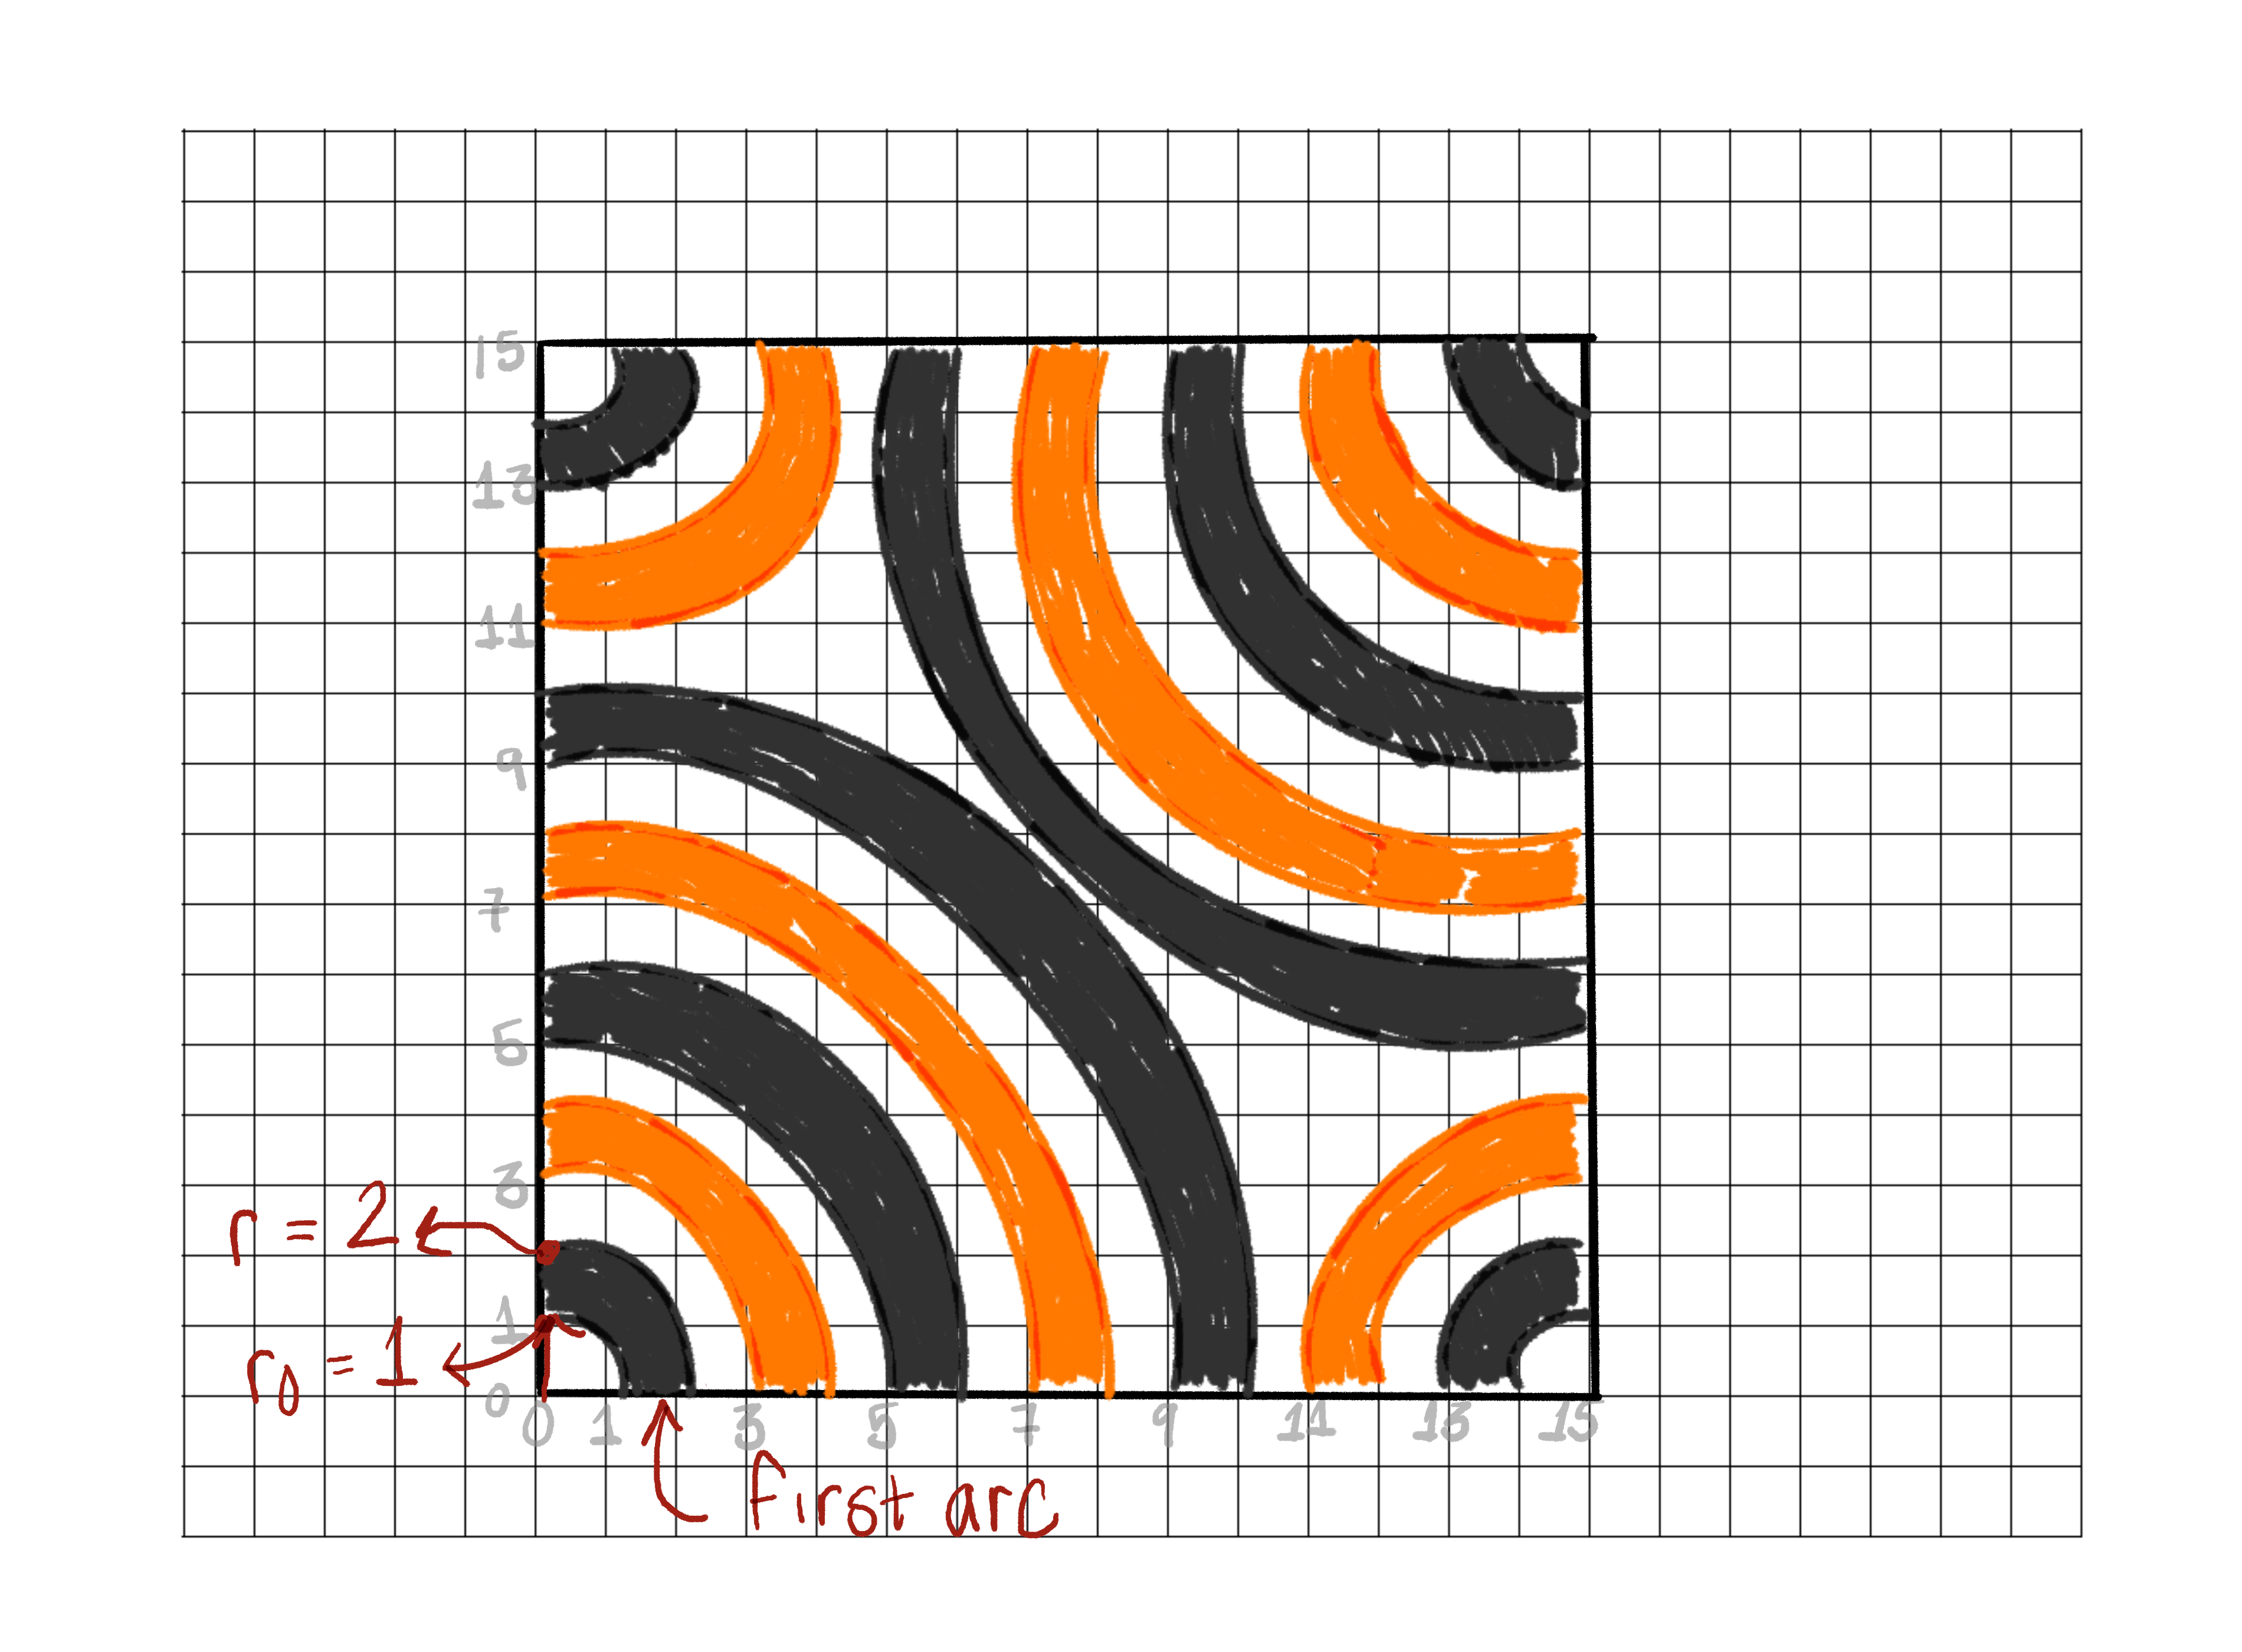
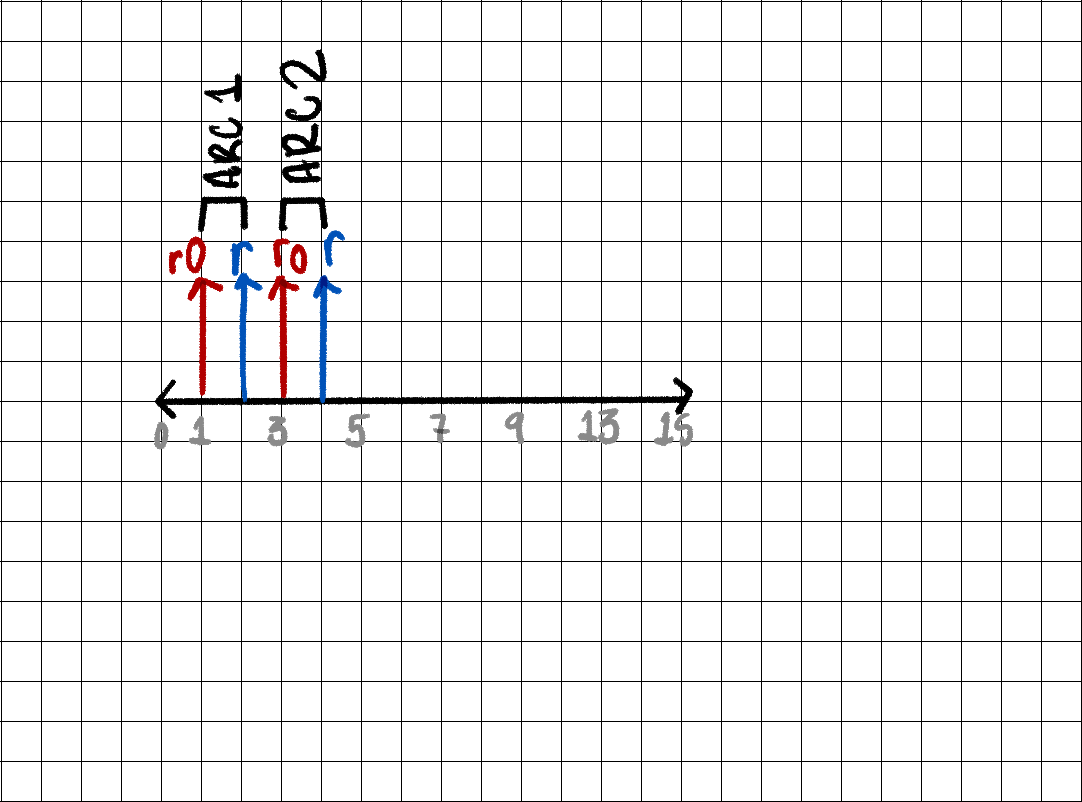
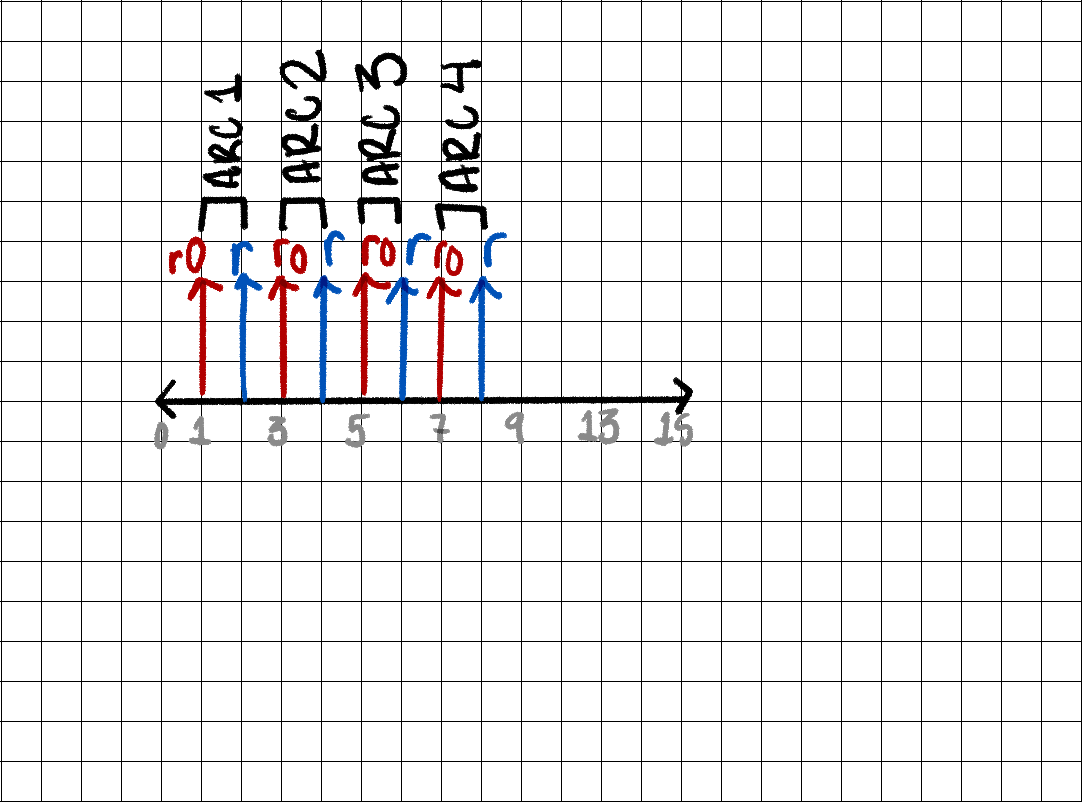
num_arcs != r or r0

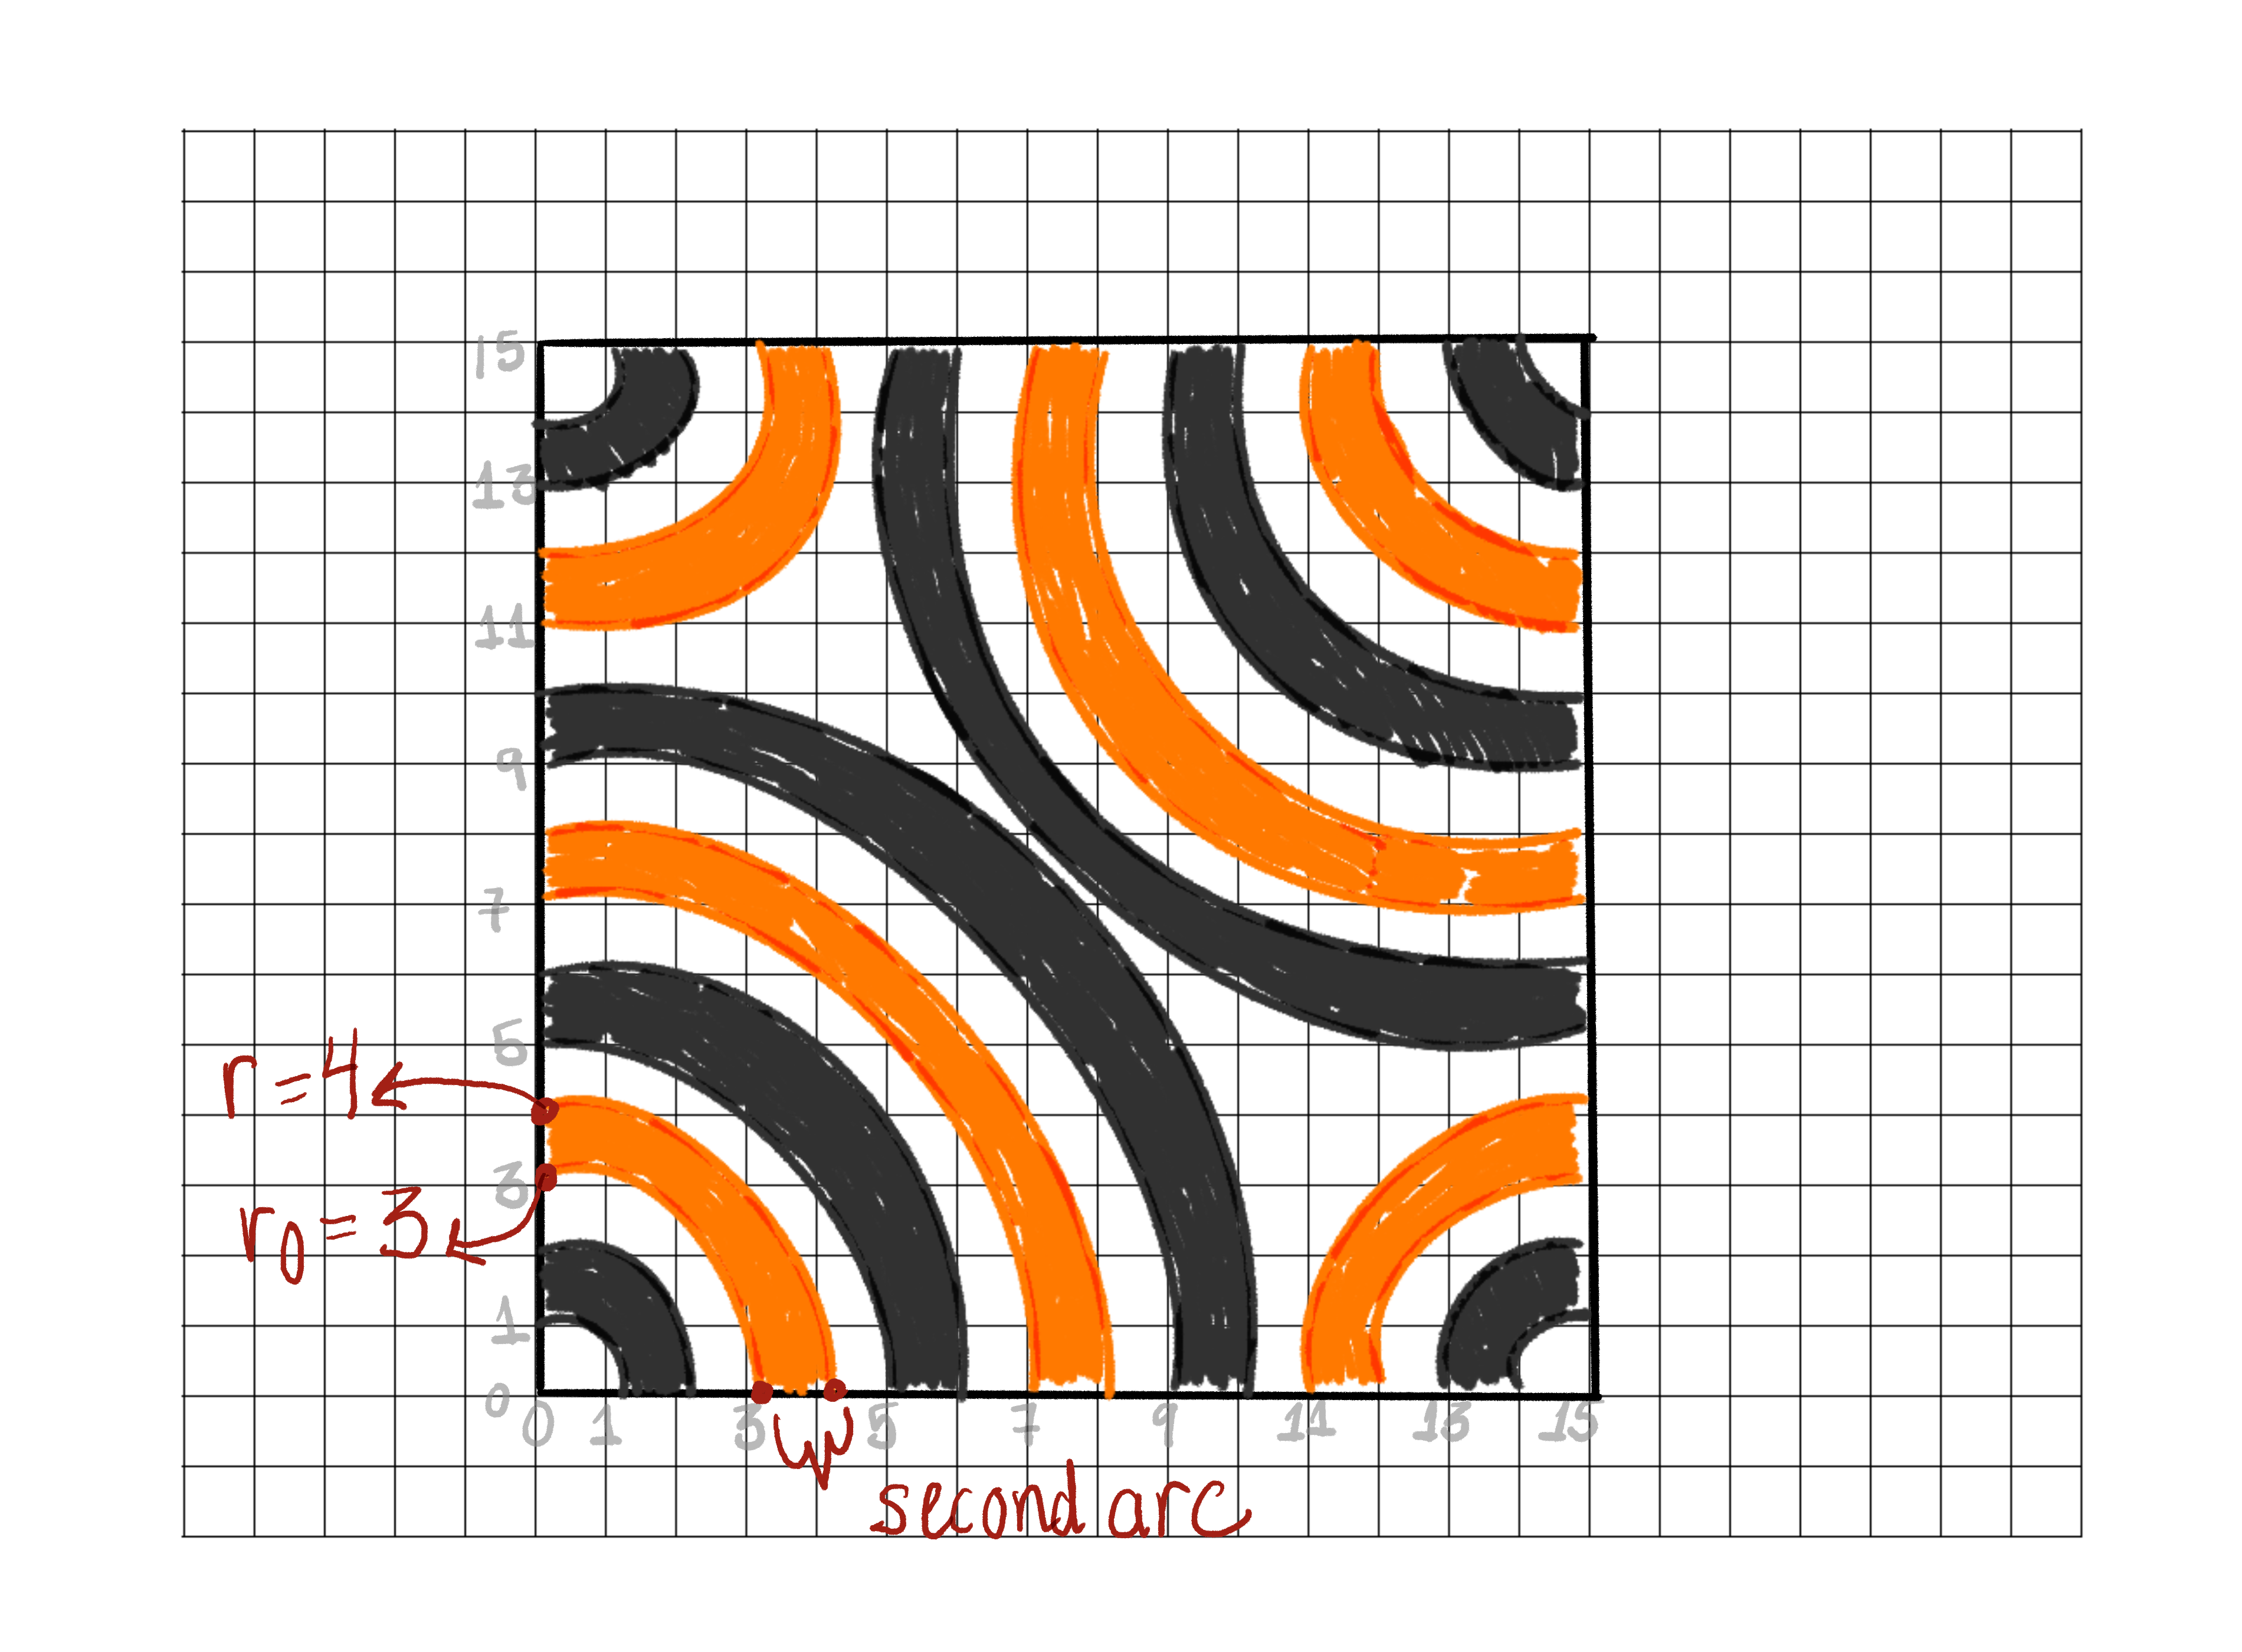
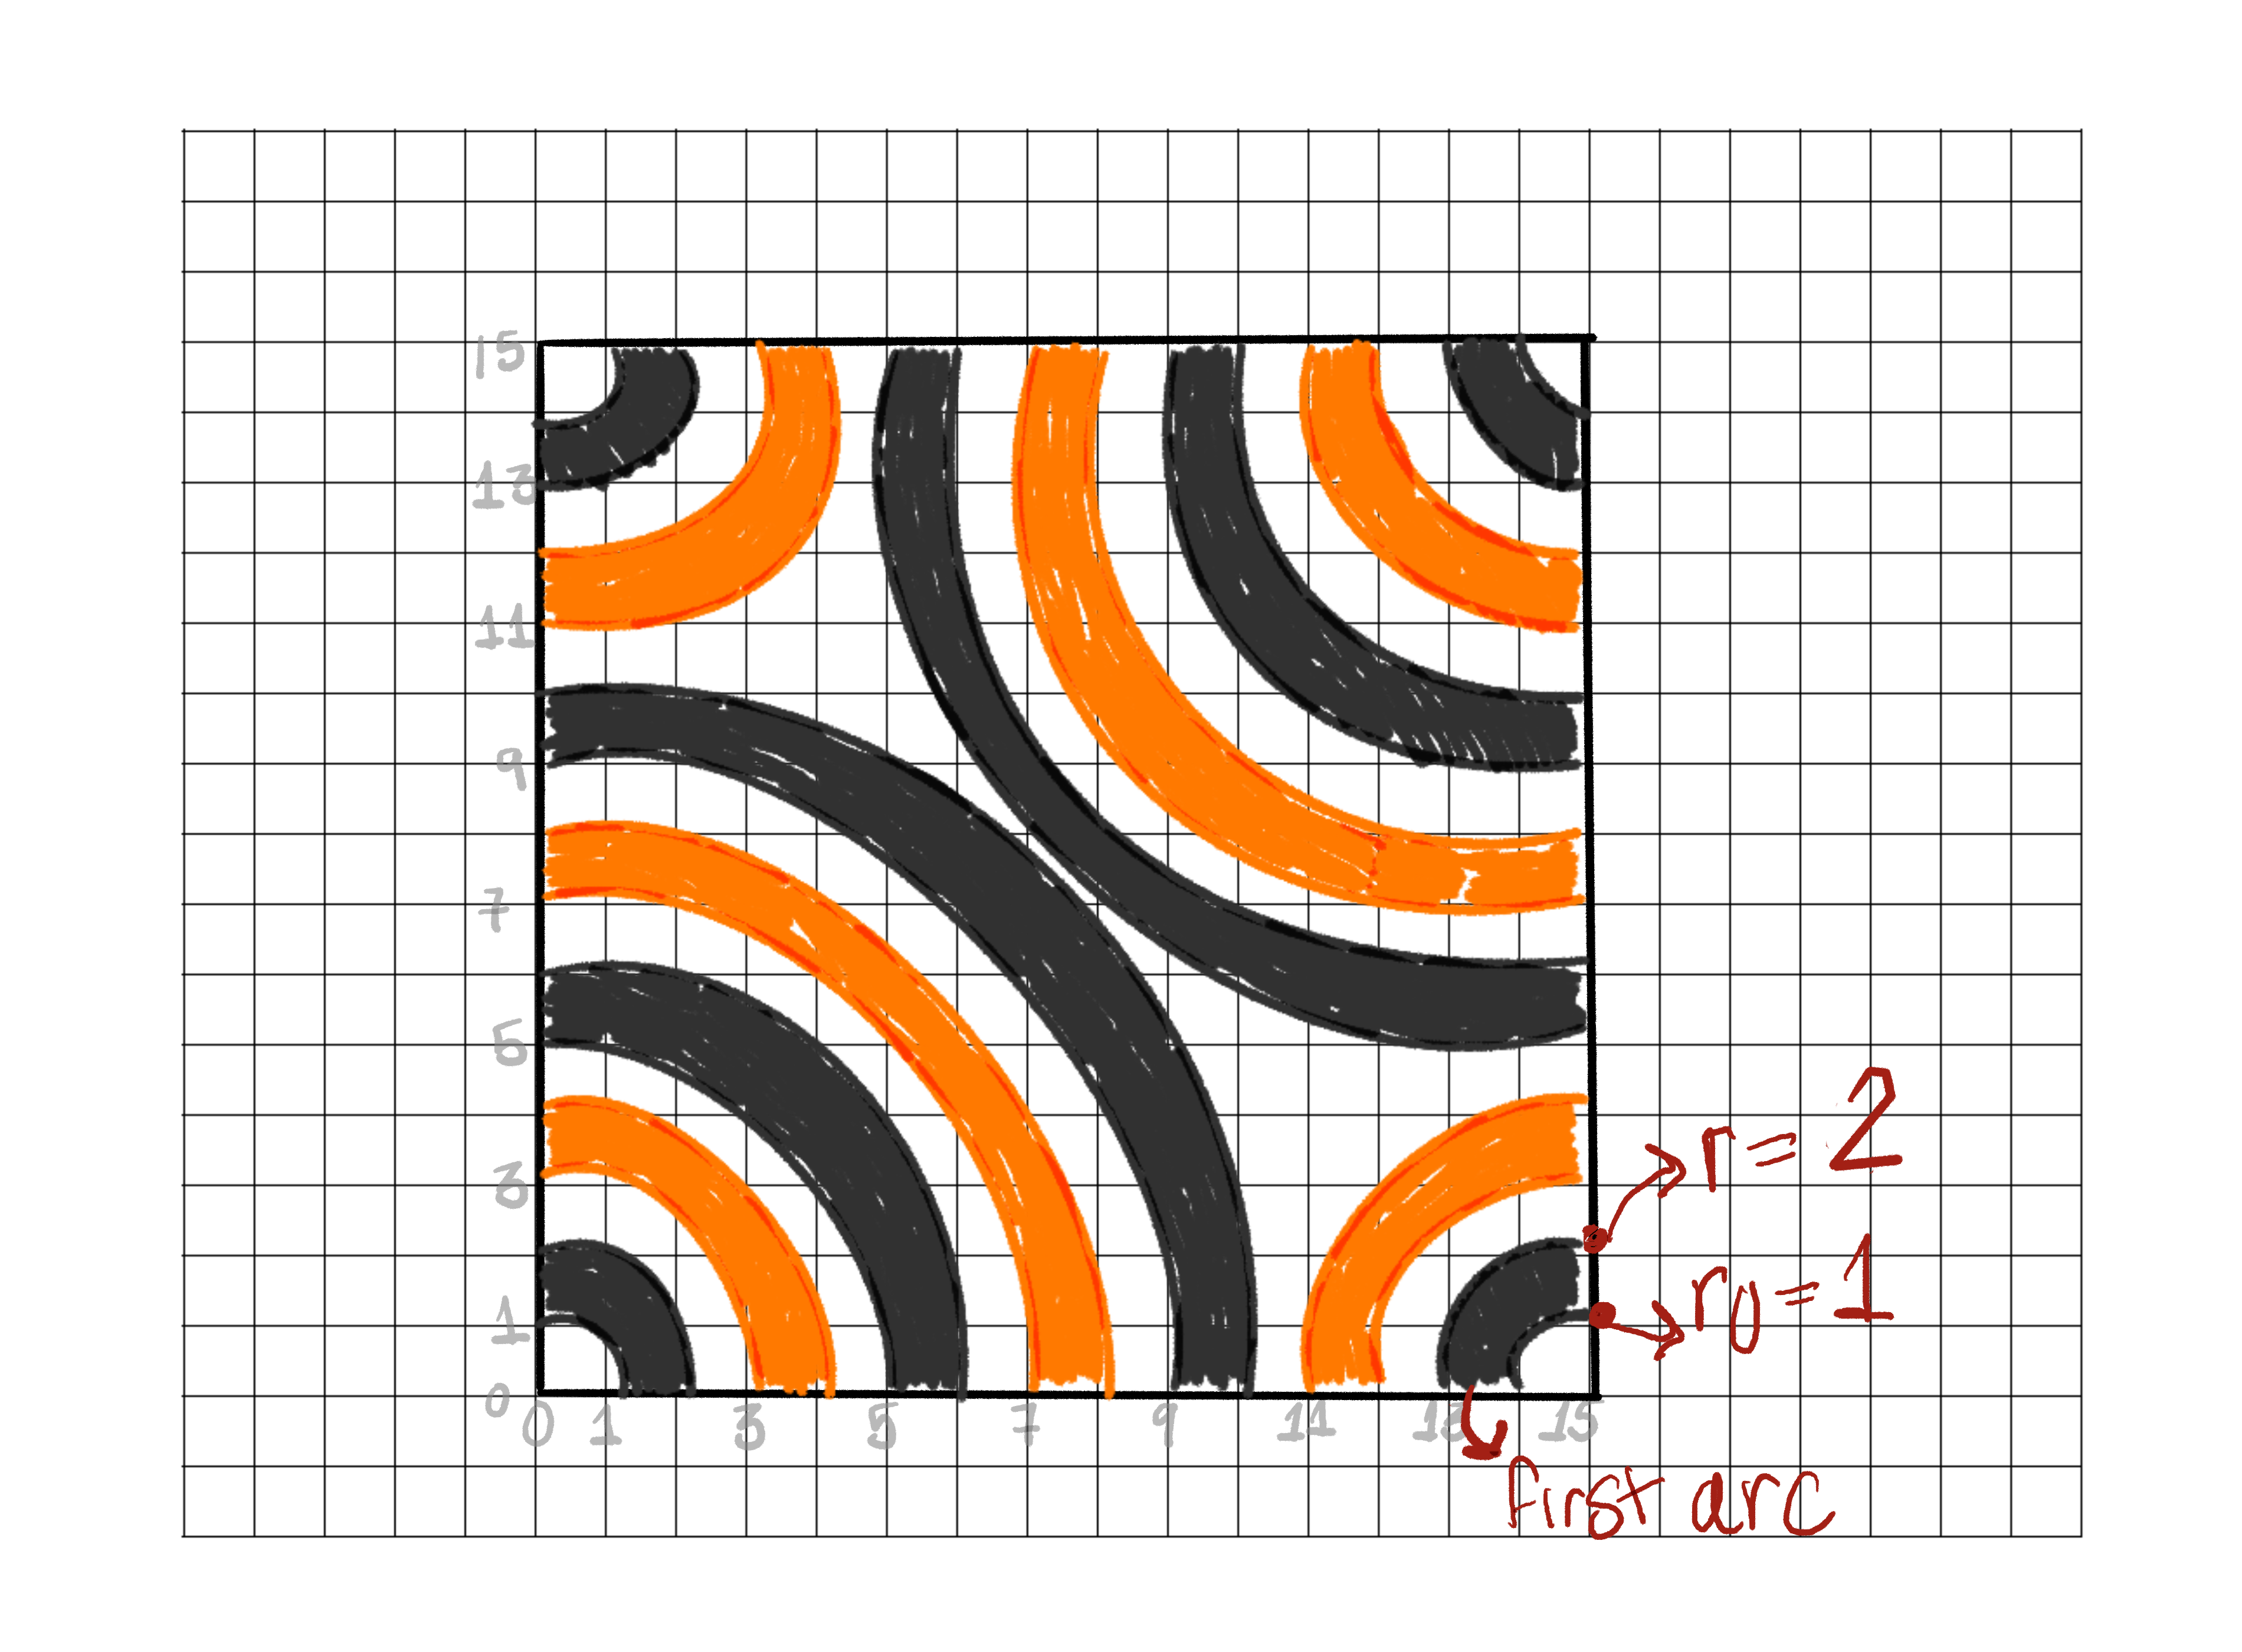
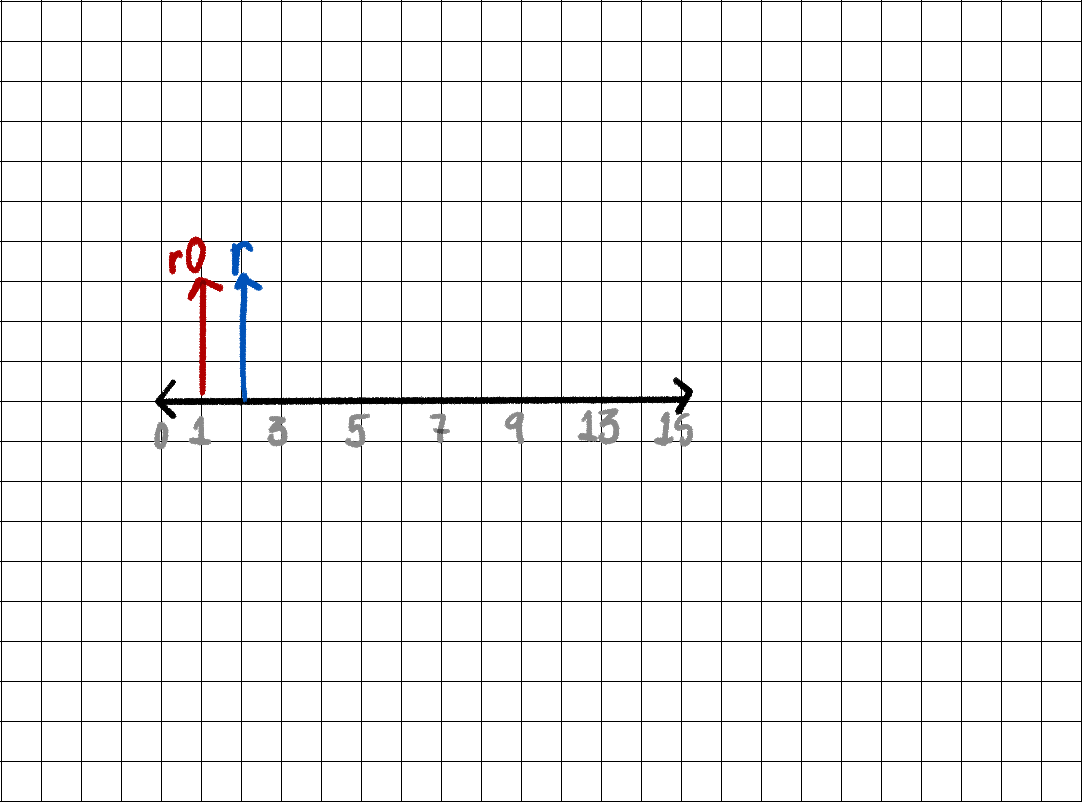
geom_arc_bar() arguments: r0, r
Always travel counterclockwise, starting in bottom left
geom_arc_bar() arguments: r0, r
geom_arc_bar() arguments: r0, r
geom_arc_bar() arguments: r0, r
geom_arc_bar() arguments: r0, r
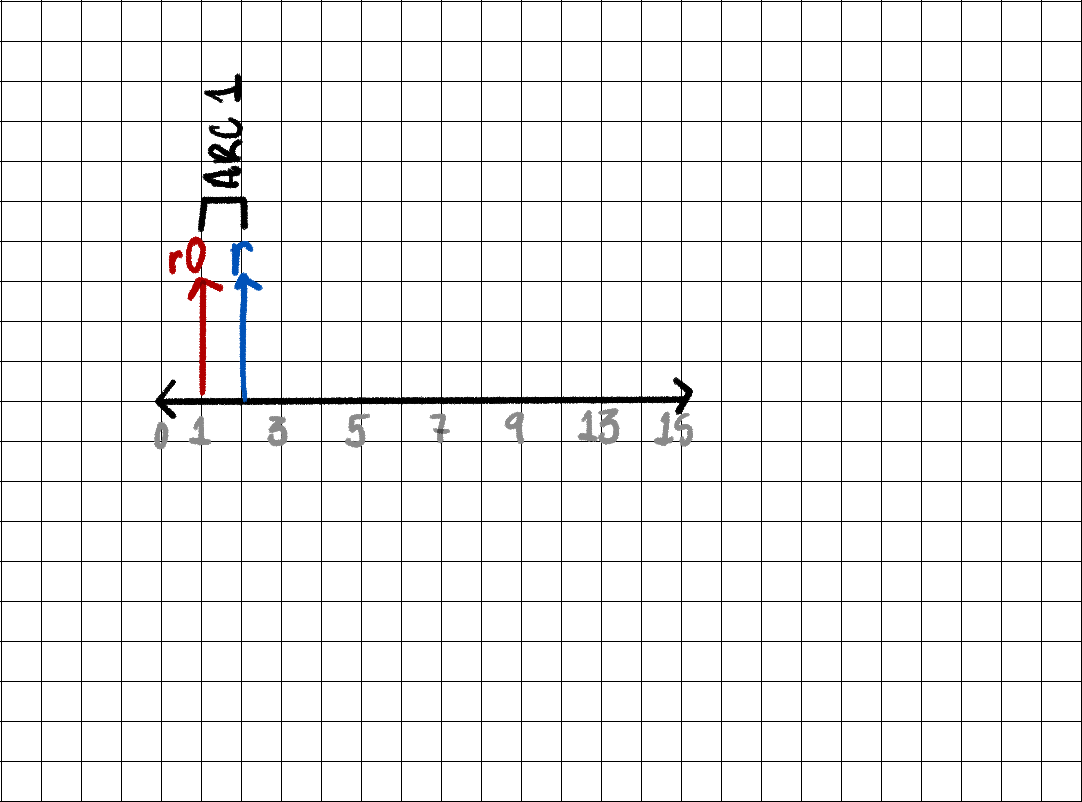
converting num_arcs to radius
geom_arc_bar() arguments: r0, r
converting num_arcs to radius
geom_arc_bar() arguments: r0, r
converting num_arcs to radius
geom_arc_bar() arguments: r0, r
converting num_arcs to radius
geom_arc_bar() arguments: r0, r
converting num_arcs to radius
geom_arc_bar() arguments: r0, r
converting num_arcs to radius
geom_arc_bar() arguments: r0, r
converting num_arcs to radius
Applying our system

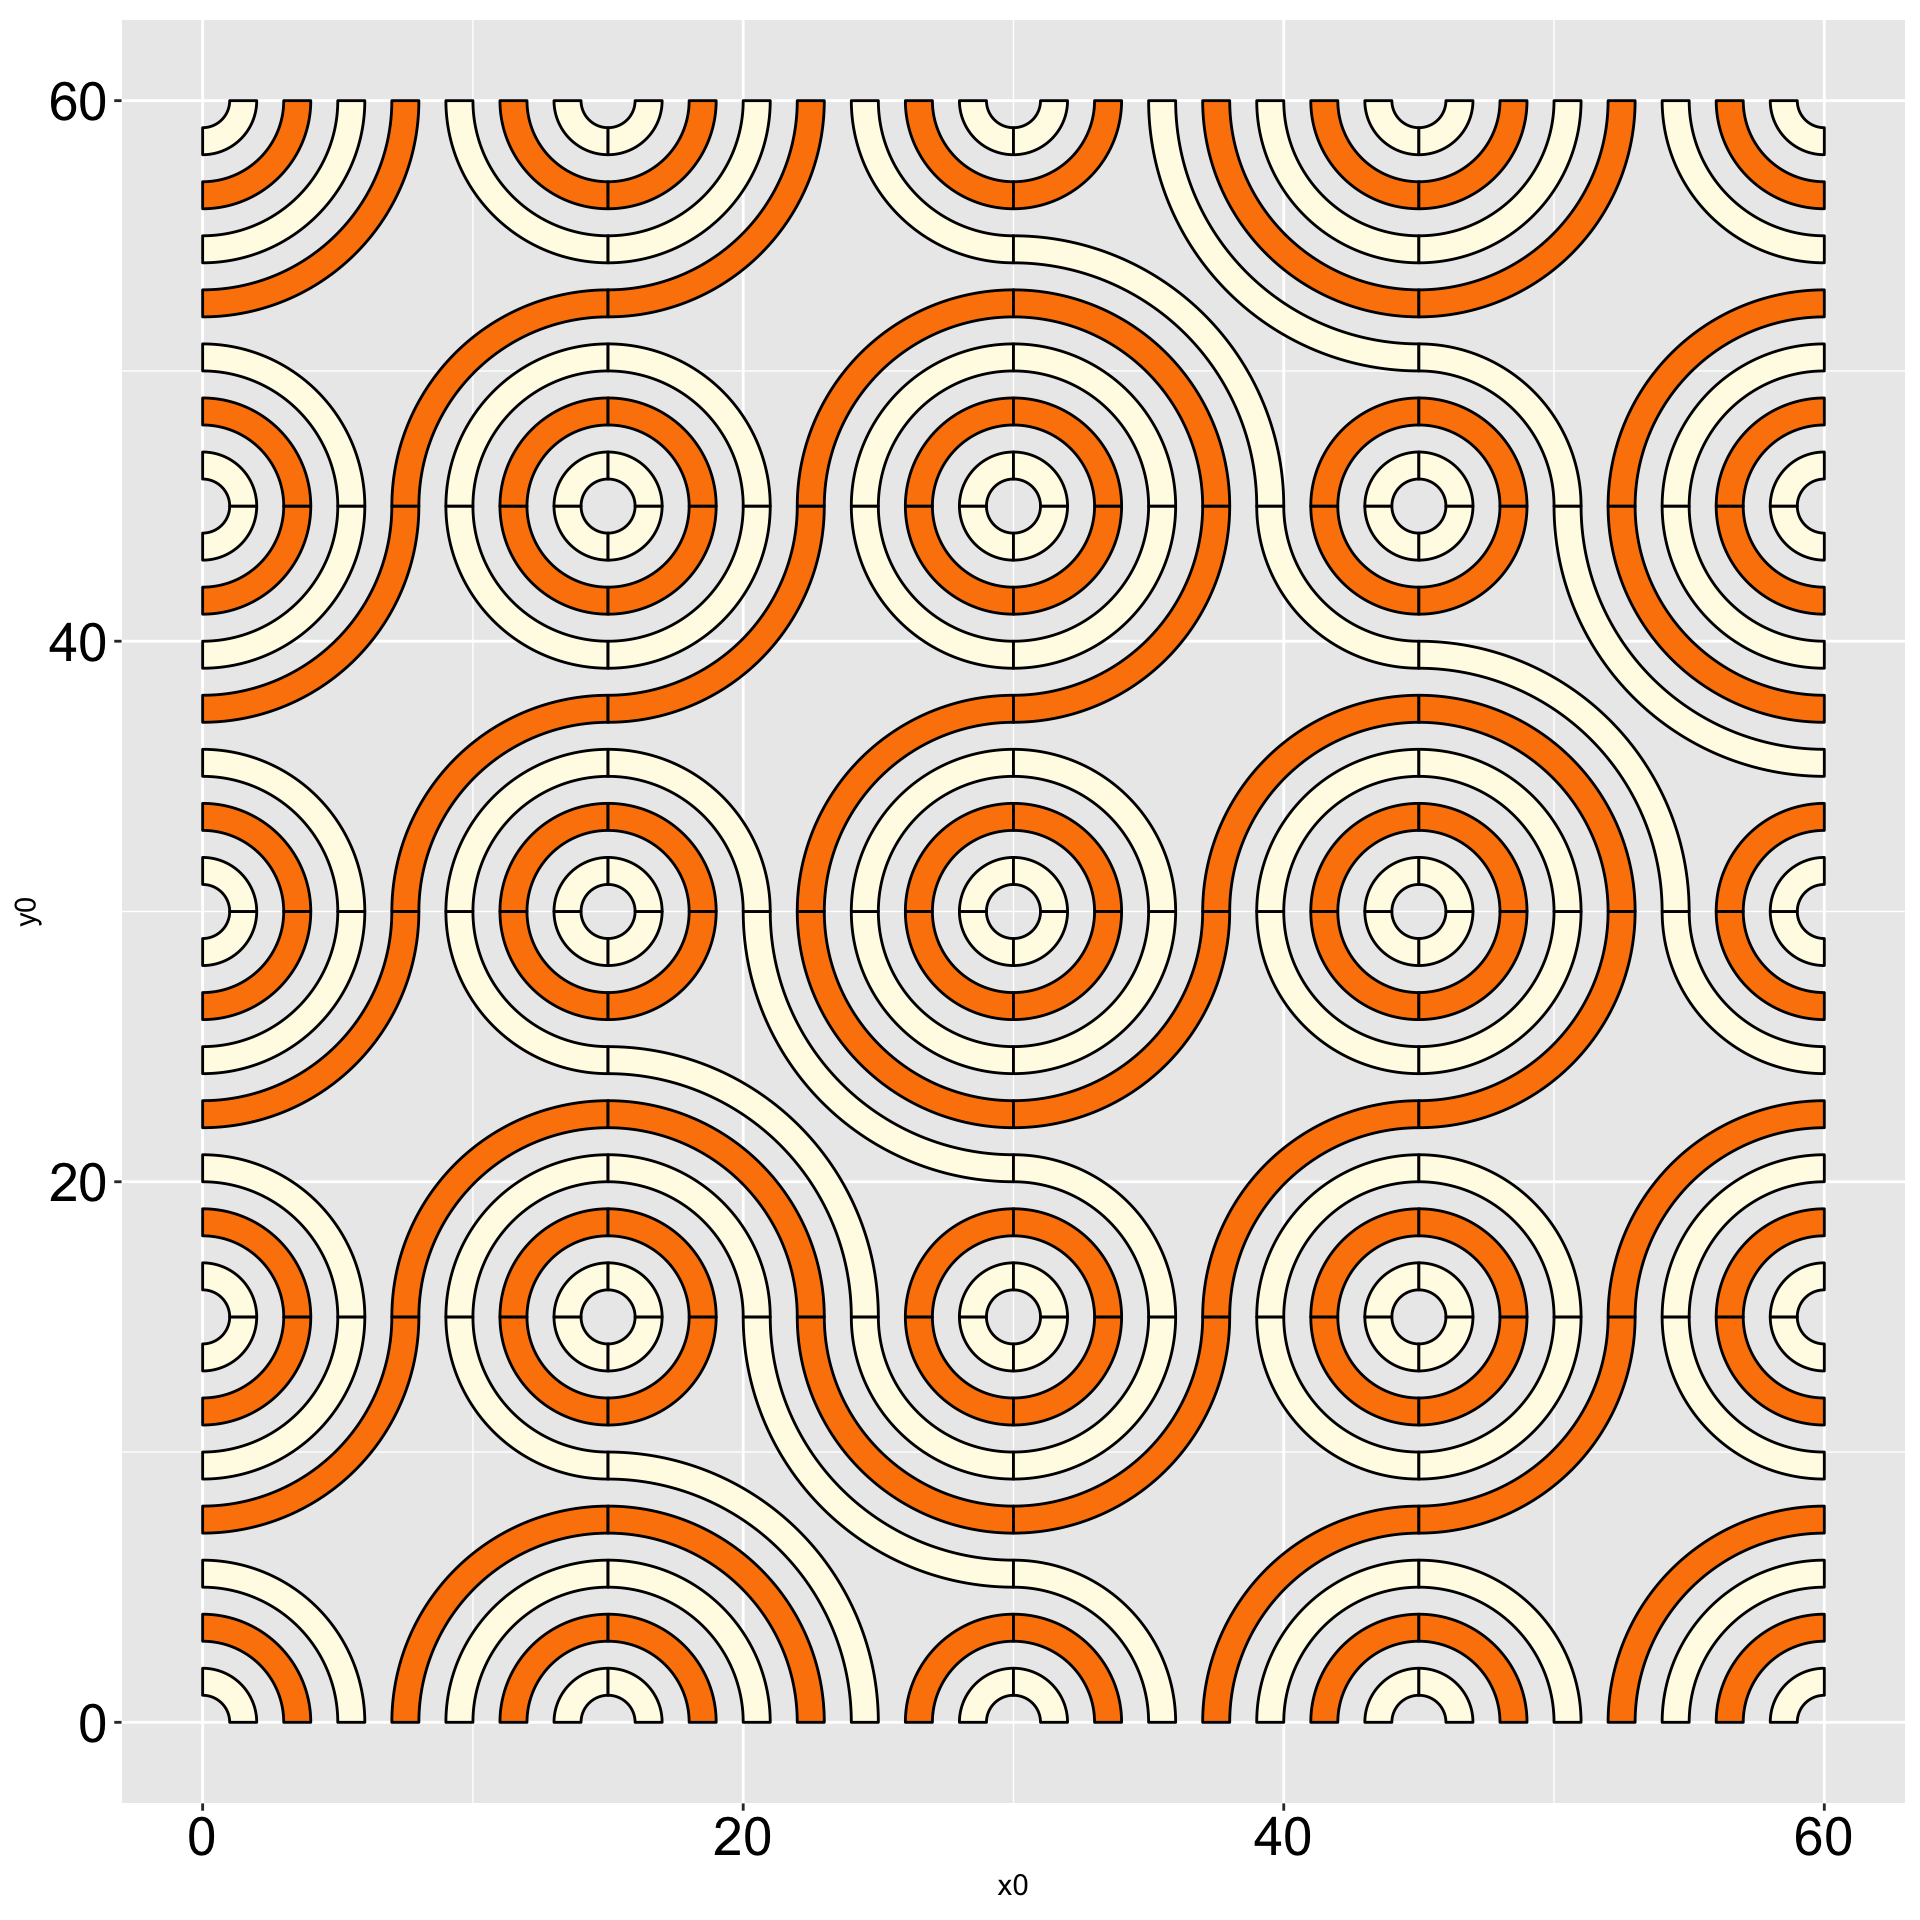
geom_arc_bar() arguments: color and fill
Color order is the same in every corner
geom_arc_bar() arguments: color and fill
Color order is the same in every corner
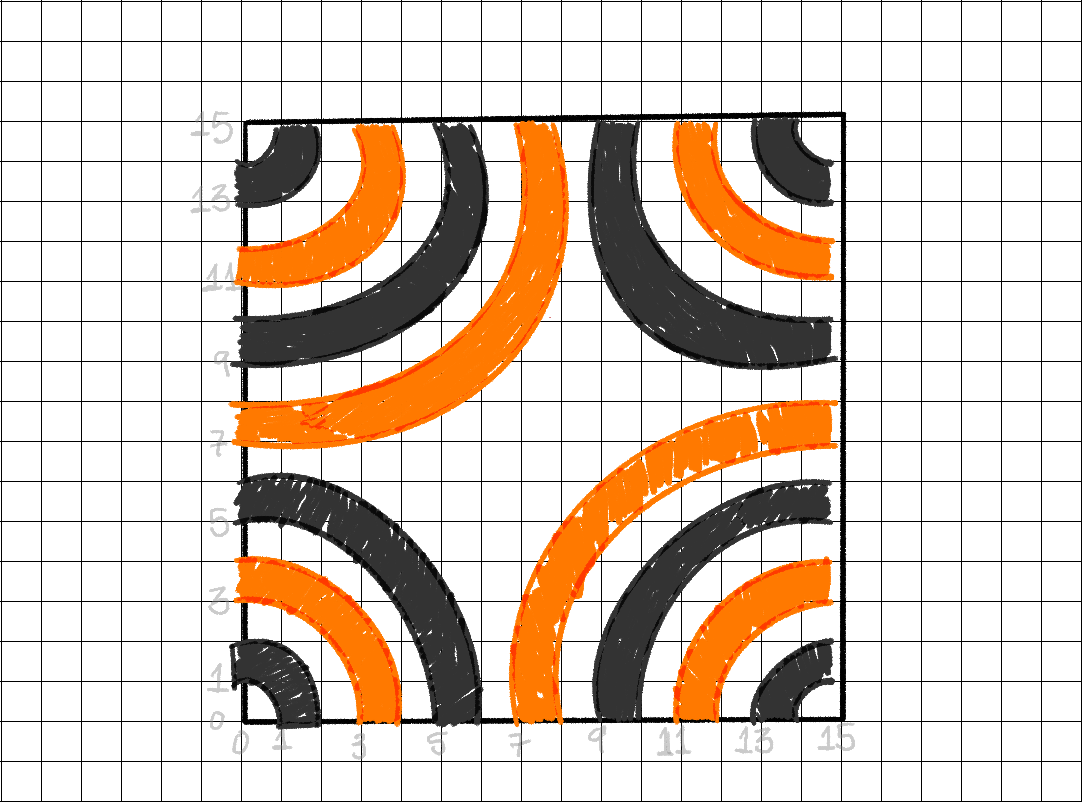
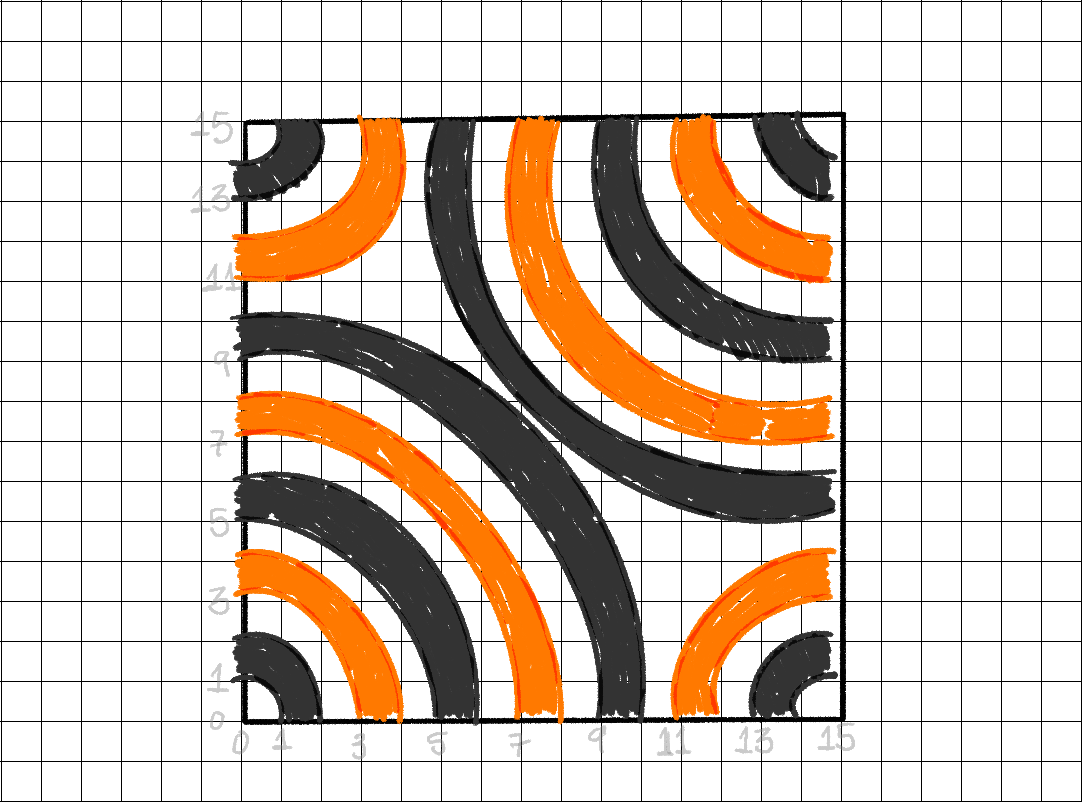
Final Piece
Final Piece
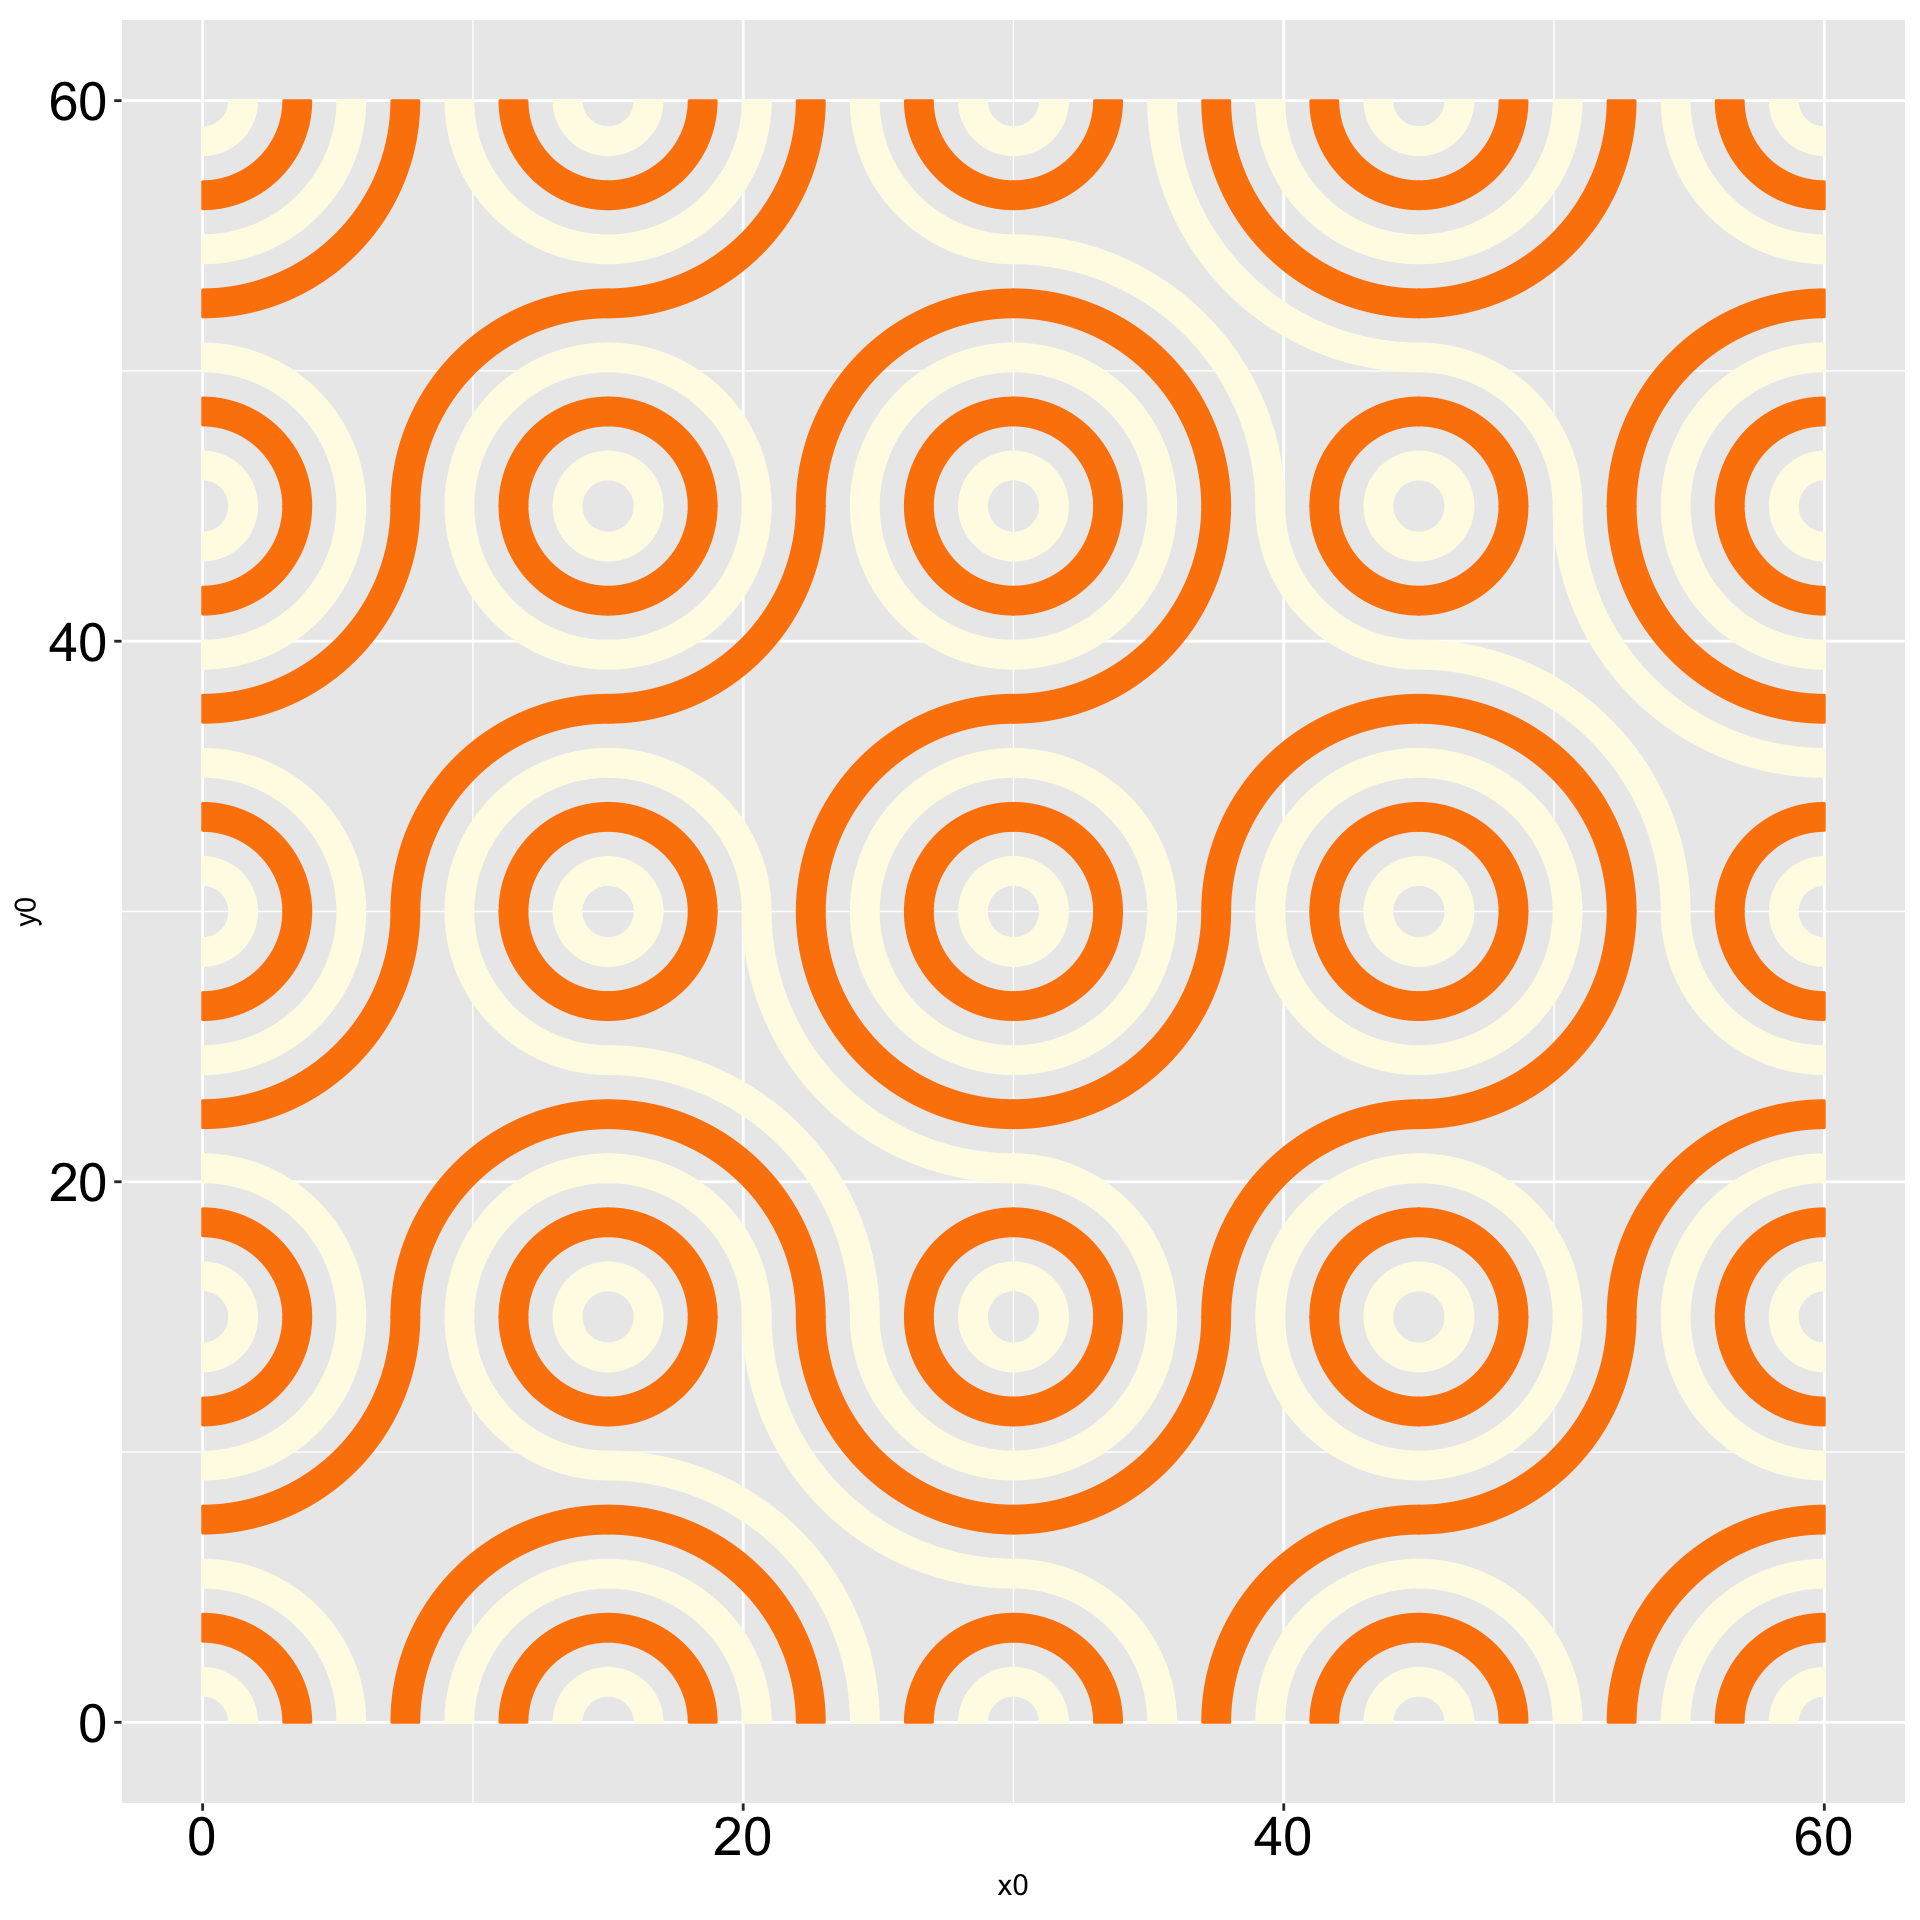
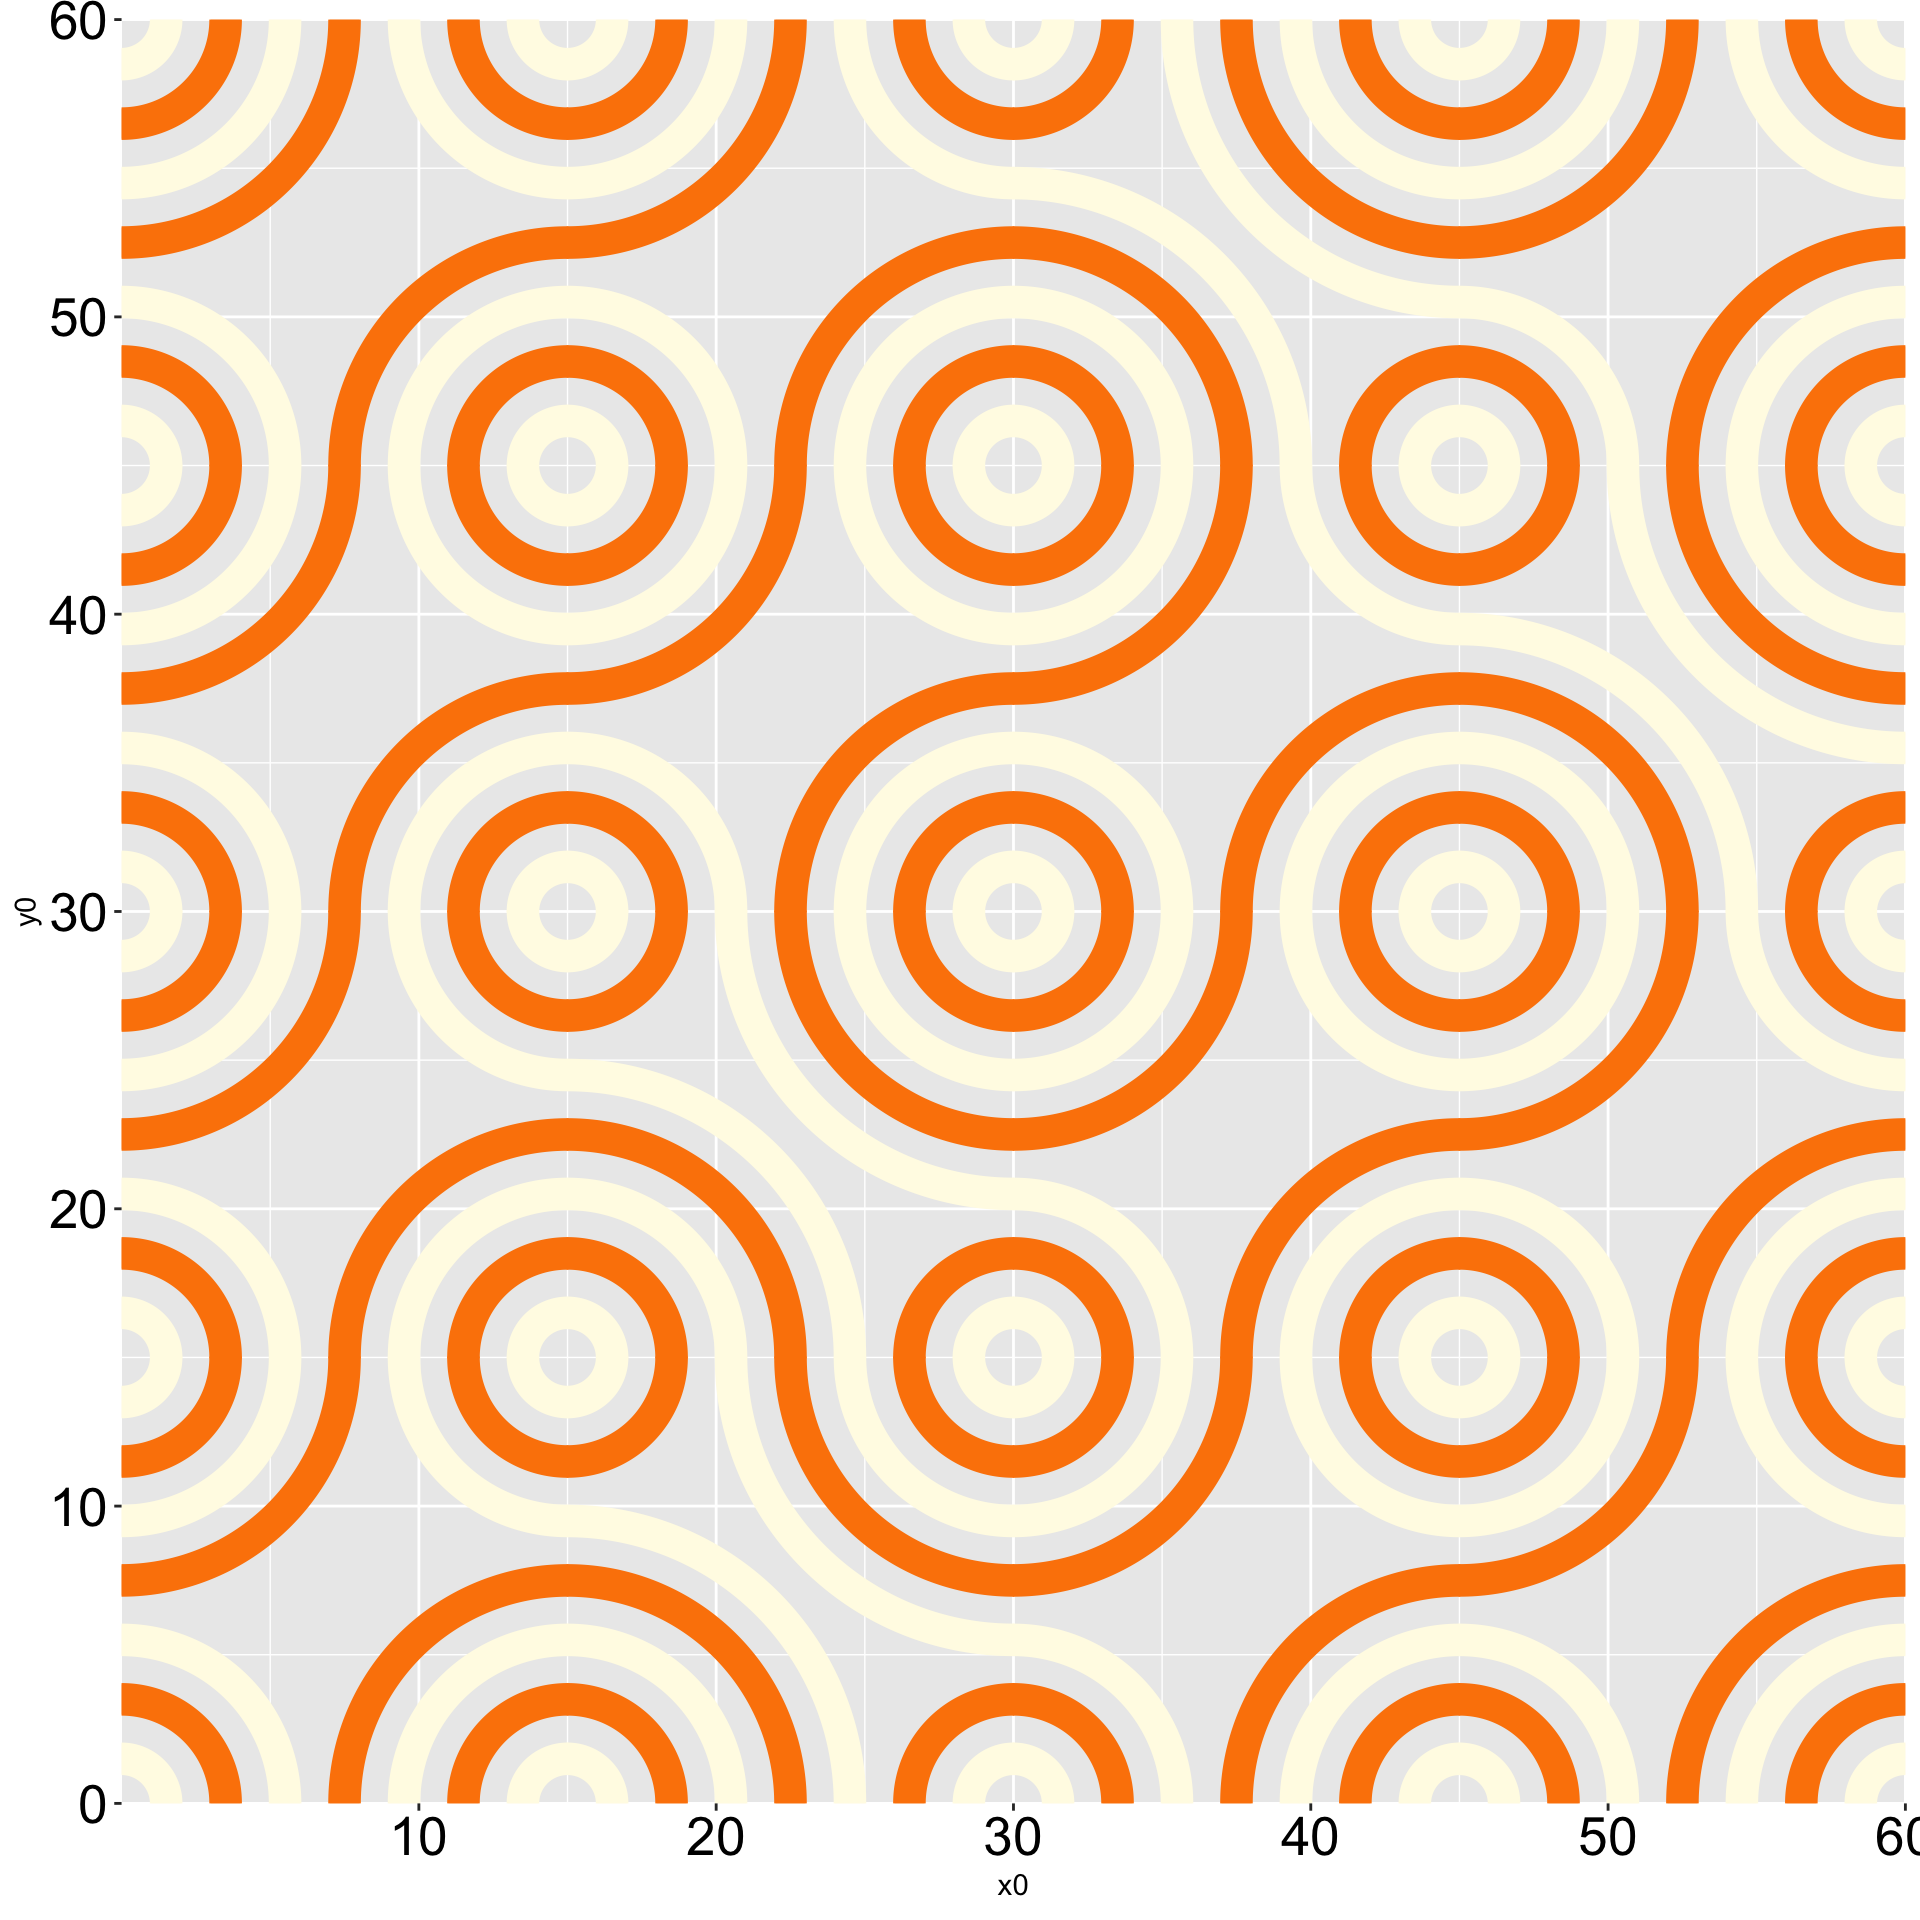
if you set color= to NA you can see the gaps between the arcs
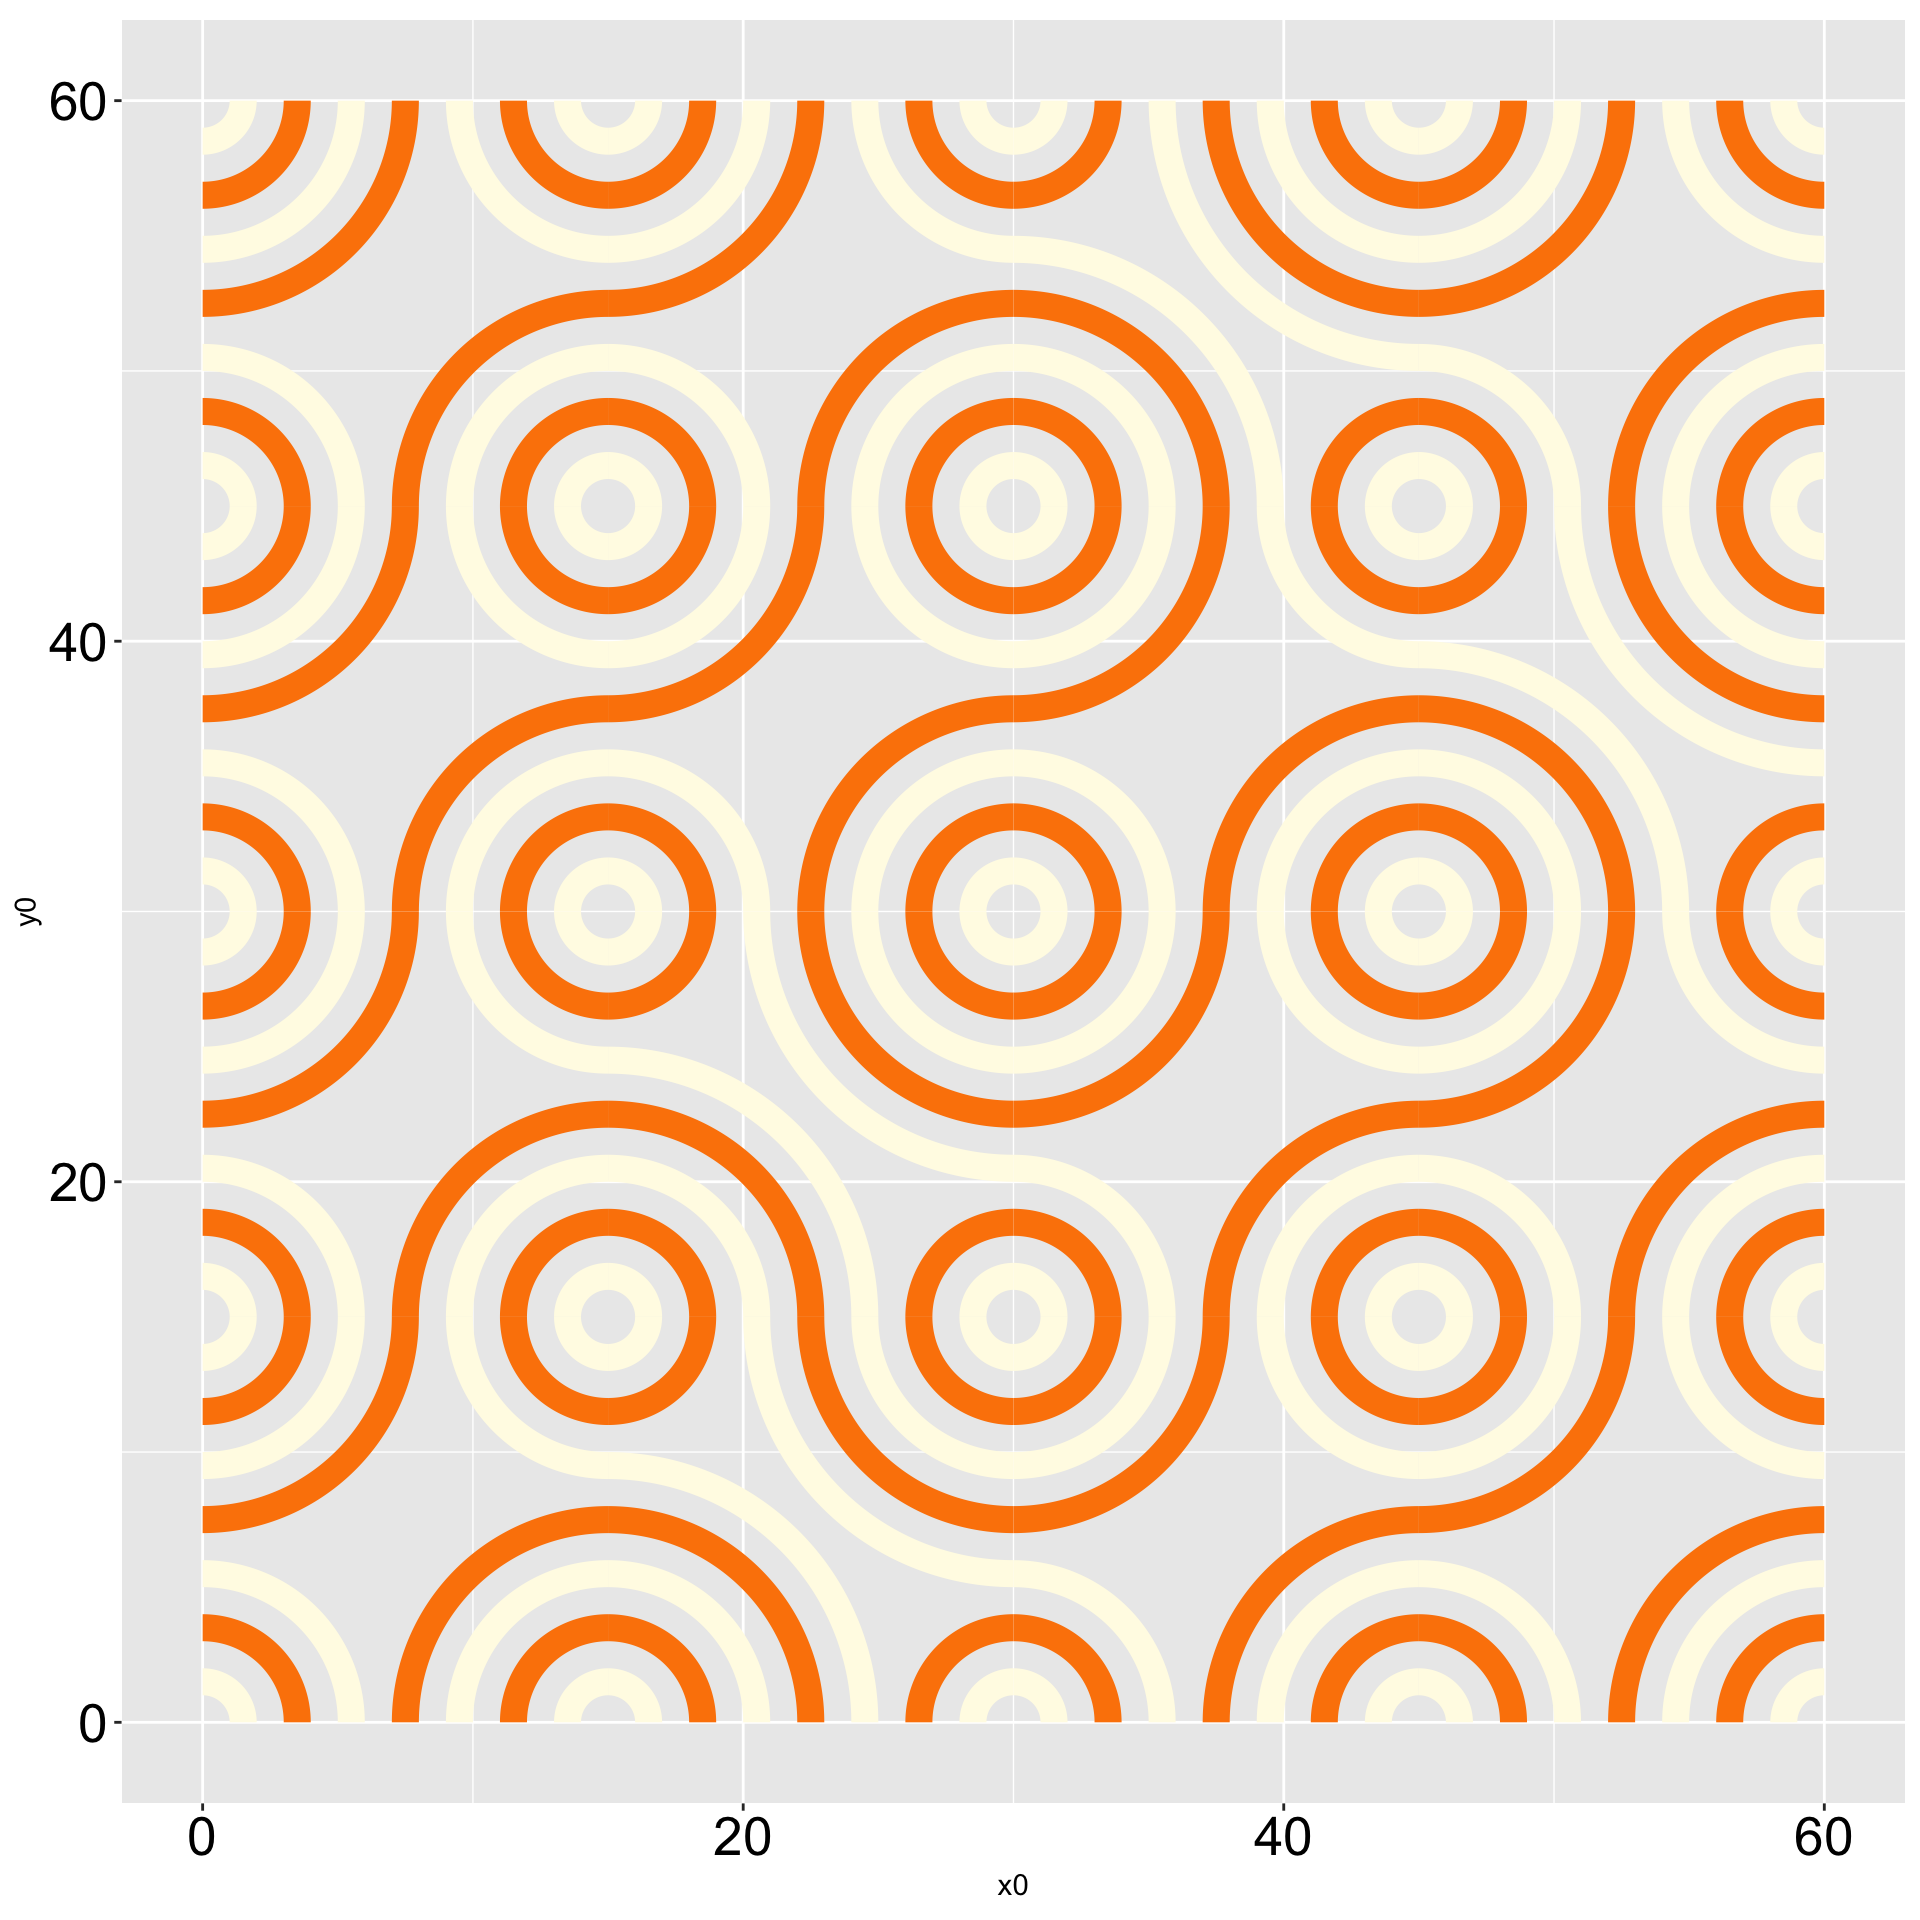
Final Piece
if you set color= to NA you can see the gaps between the arcs
Final Piece
Final Piece
expand= set to FALSE, removes margins
Final Piece

Final Piece
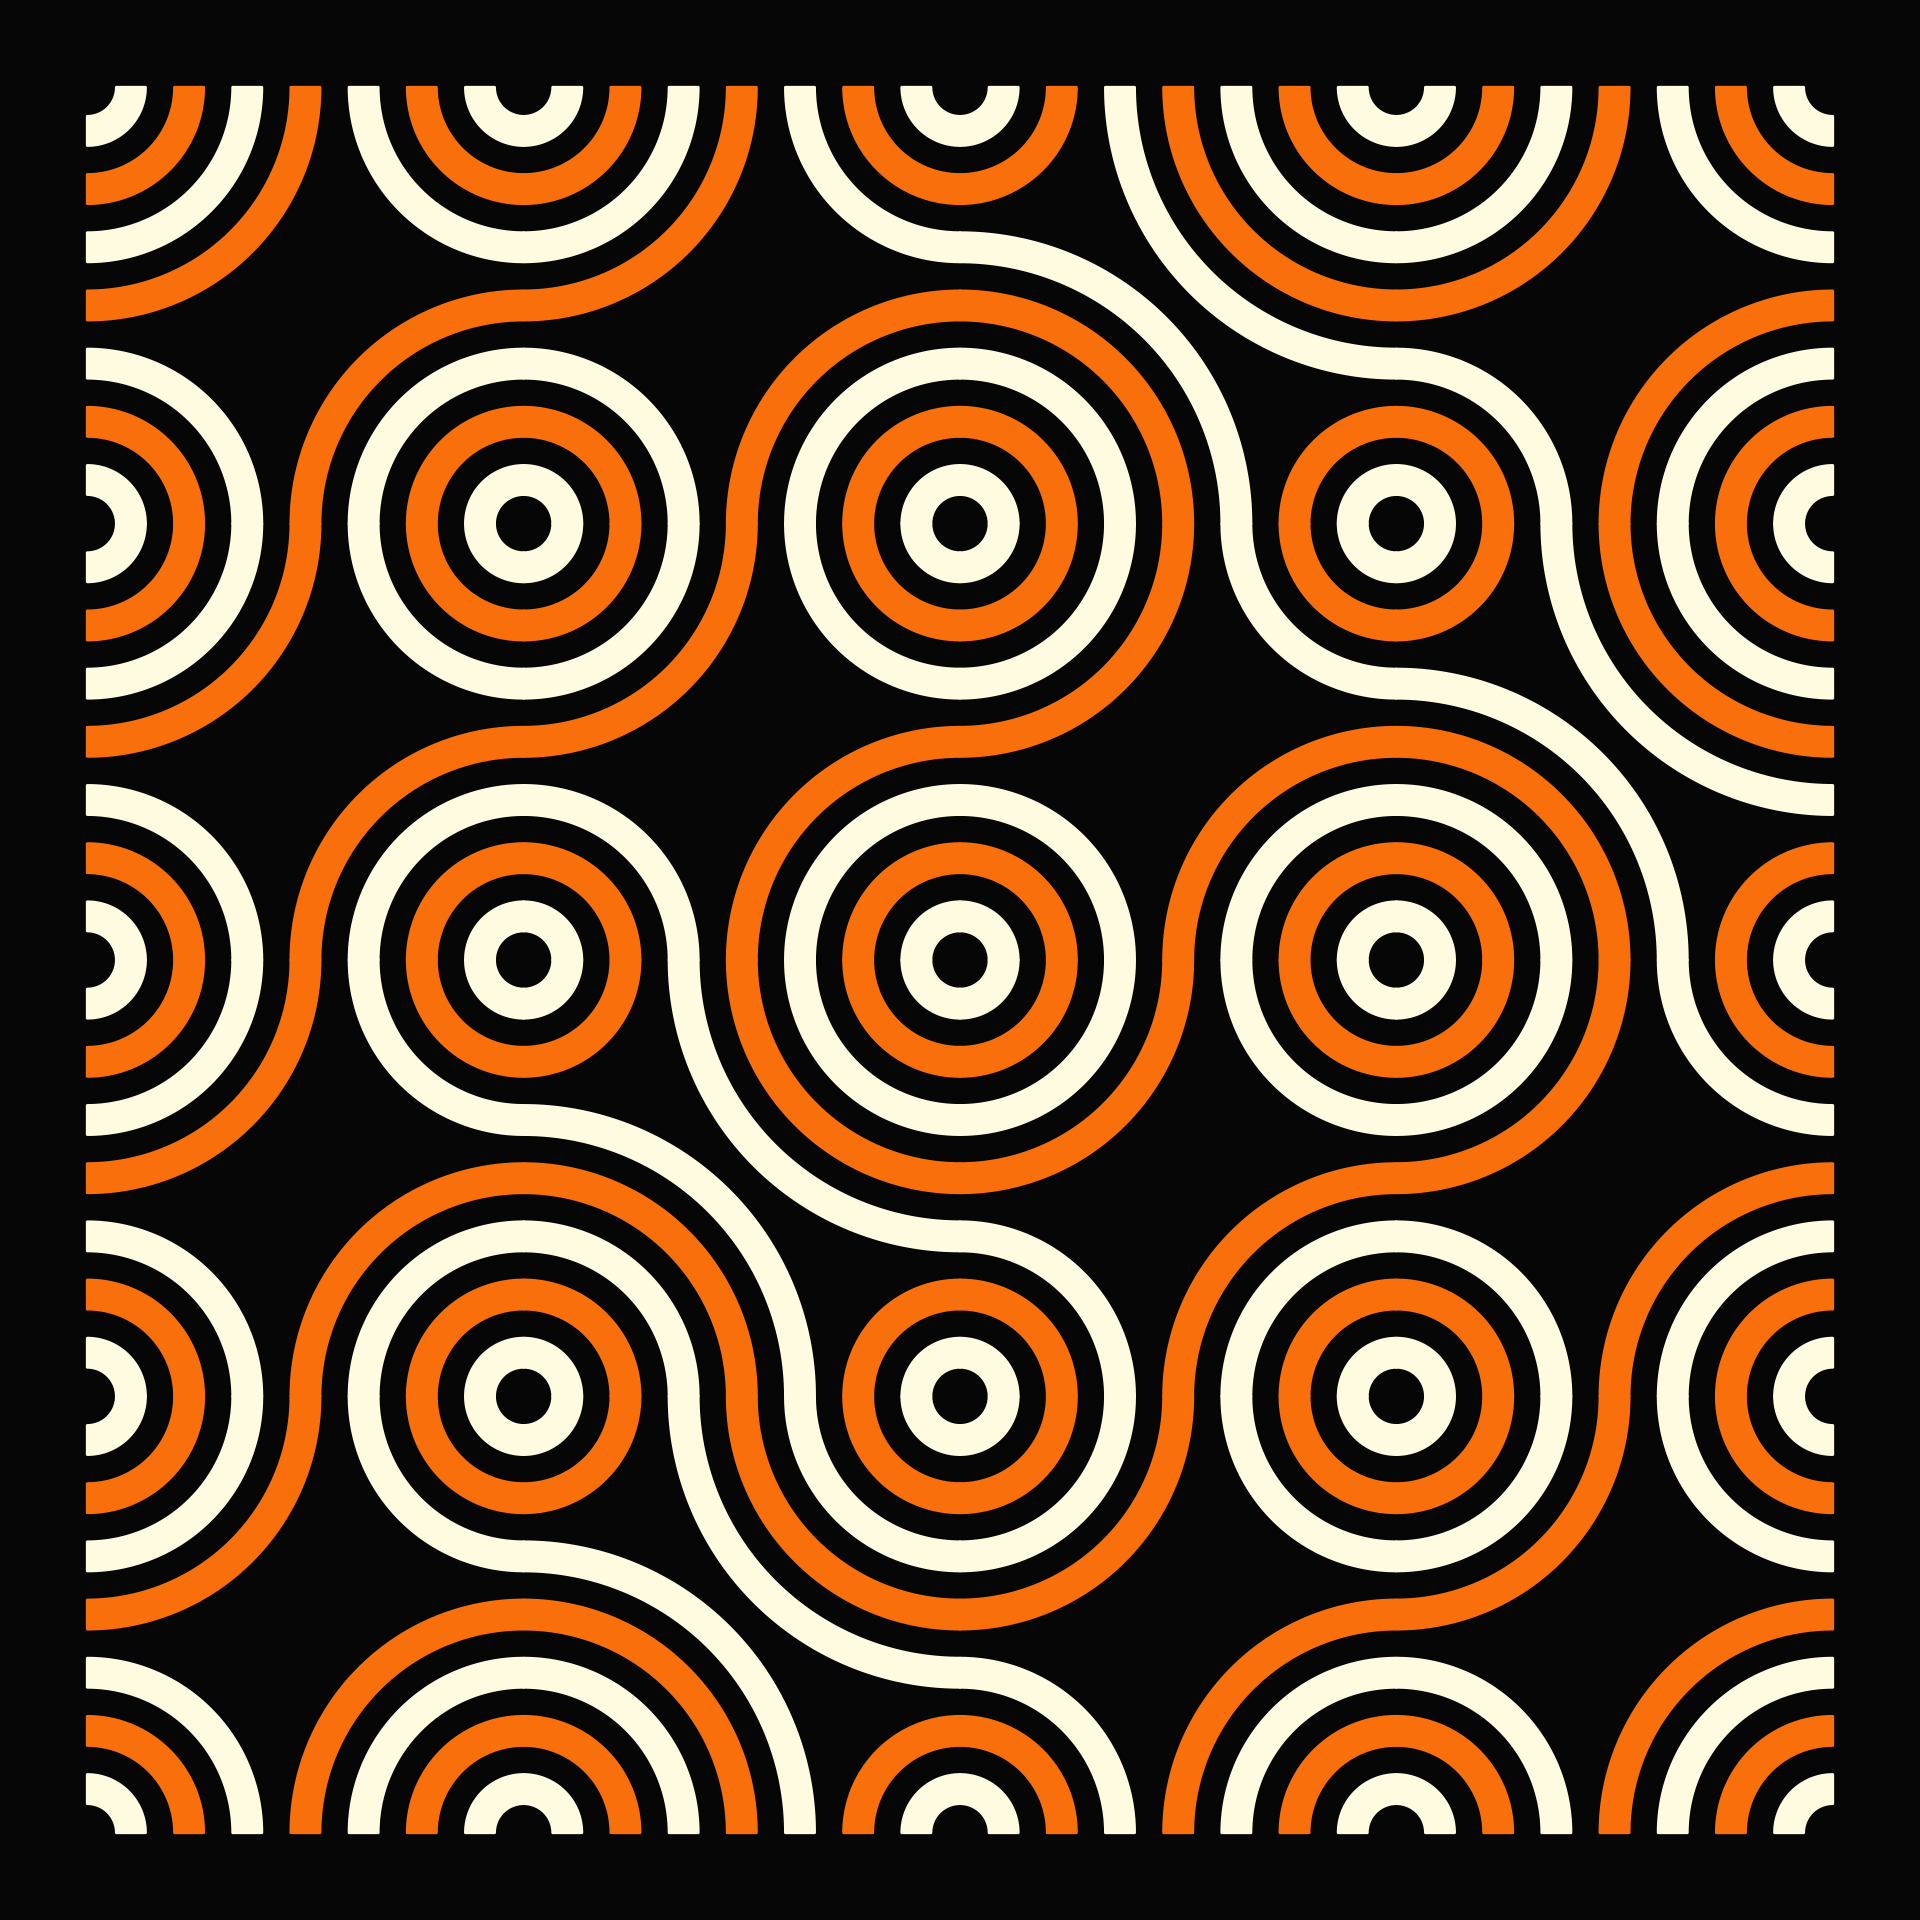

Final Piece vs. Infinite Truchet
