Working with Colors
13:30-15:00
View slides in full screen | Run the code yourself
Outline
- Pre-Defined Color Palettes
- Palette Packages
- Color Palette Quality
- Customize Palettes
- Create New Palettes
- Build Your Own Color Scales
- Design Colorblind-Friendly Graphics
- Exercises
Recap
- use categorical palettes for qualitative data
e.g.scale_*_manual()orscale_*_brewer() - use sequential or diverging palettes for quantitative data
e.g.scale_*_gradient|gradient2()orscale_*_viridis_c - various packages provide palettes incl.
scale_*components
e.g.{rcartocolors},{scico},{ggsci},{MetBrewer},{nord} - color packages return palettes as vectors that can be modified and supplied to
scale_*_manual()andscale_*_gradientn() - use
after_scaleto modify and recycle color scales - evaluate palette quality with {colorspace} (HCL) and {colorblindr} (CVD)
Exercises
Exercise 1
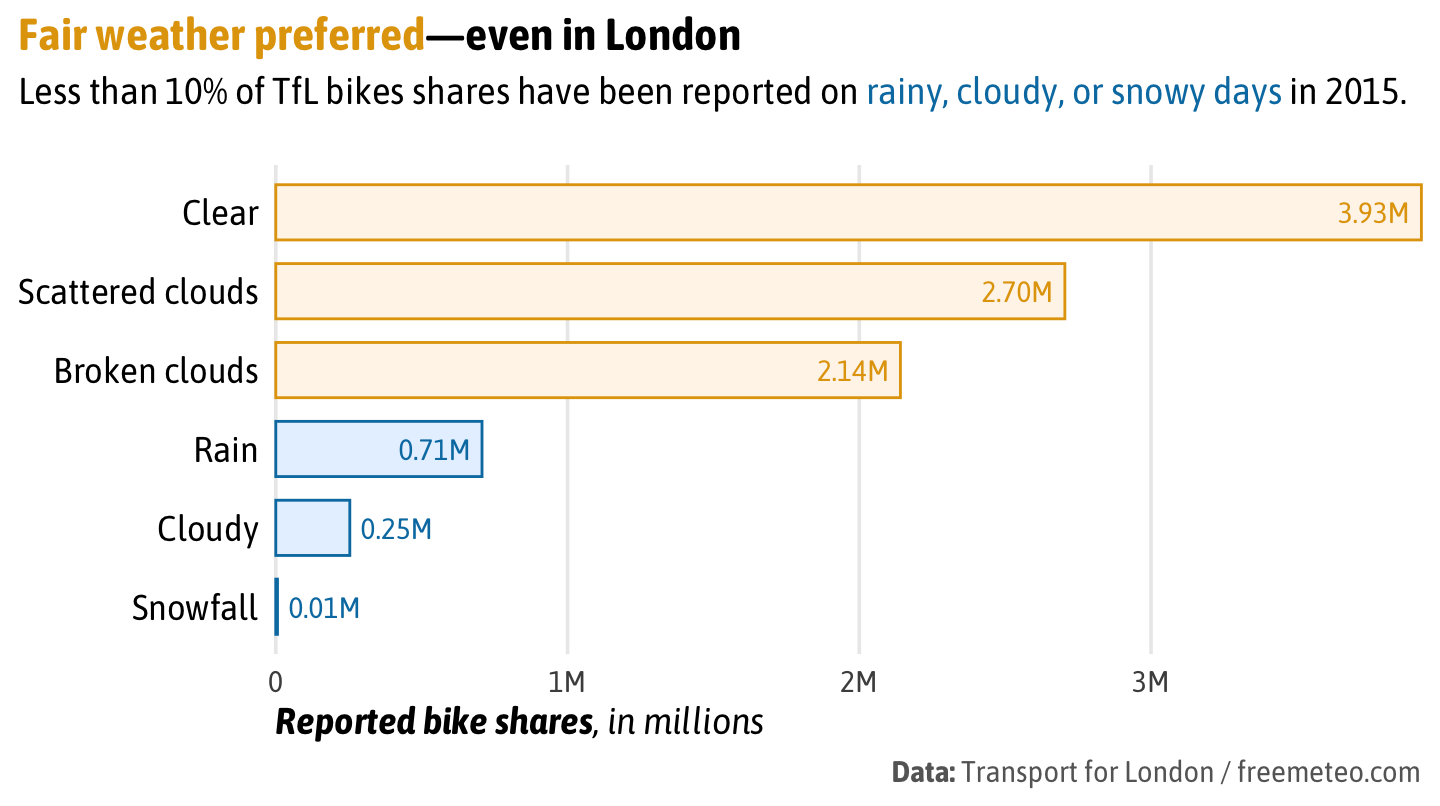
- Add colors to our bar chart from the last exercise:
Exercise 2
- Create a plot of your choice with a sequential (non-default) color palette.
- Inspect the HCL spectrum. Adjust the palette if needed.
- Test the palette with regard to colorblindness. Adjust the palette if needed.
- Save and share the graphic.